If you’re trying to make sense of EV sales statistics in 2026, you’re not alone. Global electric car volumes keep hitting records, yet U.S. growth has clearly cooled, incentives are in flux, and used EV prices have come back to earth. Understanding what actually happened in 2024–2025 is the key to spotting good deals, and avoiding bad bets, in today’s market.
Data snapshot for 2024–2025
Why EV sales statistics in 2026 matter
EV headlines in 2025 and early 2026 were all over the place, "EV boom continues" one week and "EV demand collapses" the next. When you dig into the numbers, a more nuanced story emerges: global EV demand is still growing fast, but the pace and mix by region, brand, and powertrain are shifting.
- Global EV sales are still climbing at double‑digit rates, even as some markets plateau quarter to quarter.
- China has become the center of gravity for both EV production and sales, influencing prices worldwide.
- The U.S. is in a "second phase" of adoption, with growth continuing but more uneven by brand and segment.
- Used EVs are moving from early‑adopter novelty to mainstream used‑car inventory, often at steep discounts versus new.
How this helps you as a shopper
Global EV sales statistics through 2025
Global EV market by the end of 2025
Put simply, 2025 was another record year worldwide. Even as some markets, especially the U.S., saw softer quarters late in the year, the global EV adoption curve is still sloping upward. Where the story gets interesting is in the regional breakdown, and that matters a lot for inventory and pricing in the U.S. used‑EV market.
Regional EV market share: China, Europe, U.S.
Mind the margin of error
U.S. EV sales statistics and market share
The U.S. is where the narrative diverges from the global story. EVs are still growing here, but not at the breakneck pace of 2020–2022. The market is transitioning from early adopters to more price‑sensitive mainstream buyers, and that shows up in the numbers.
U.S. EV market snapshot
Early 2026 monthly data points to a market that’s still growing year‑over‑year, but selectively. Mainstream crossovers with strong lease deals and clear tax‑credit eligibility are holding up; higher‑priced niche models and trucks are seeing more softness.
New vs. used: two different U.S. stories
Brand market share: From Tesla to BYD and beyond
What this means for pricing
Used EV sales statistics and pricing trends
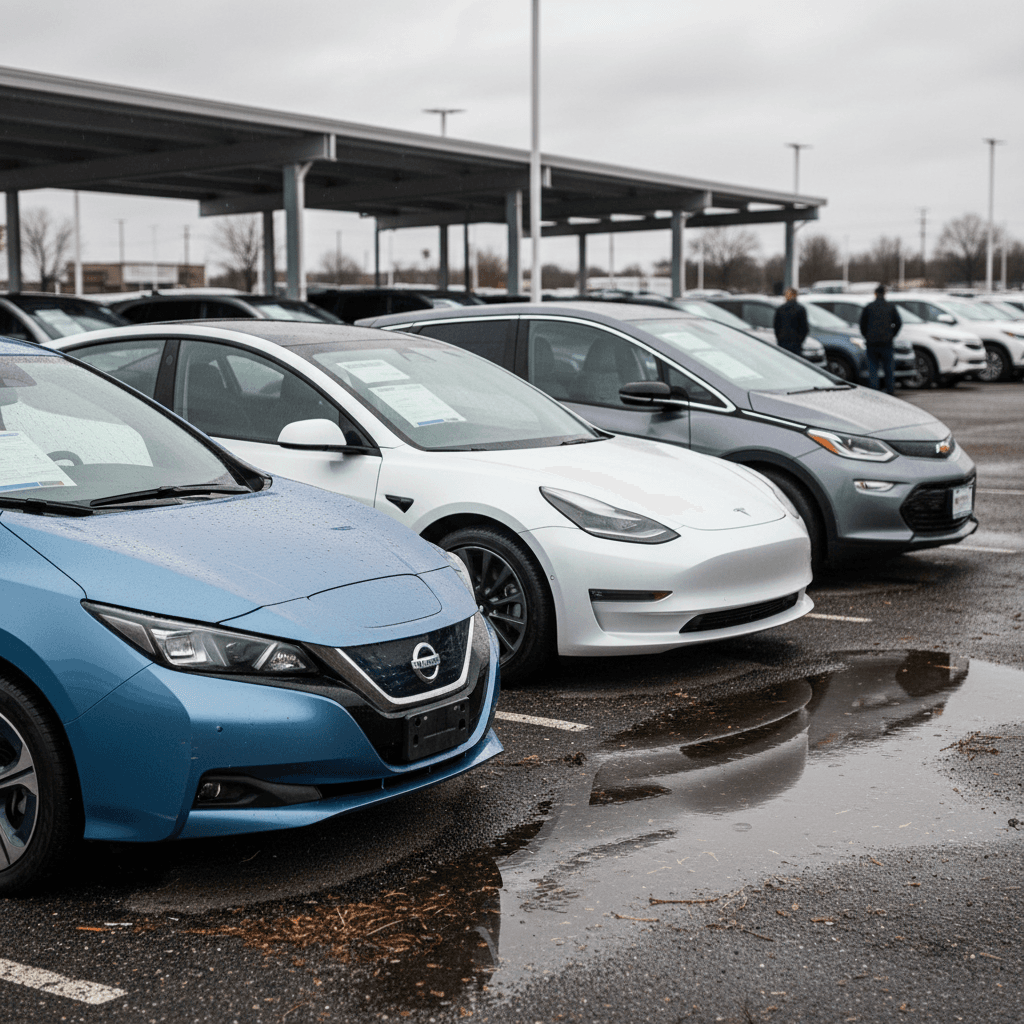
Used EVs lag new‑EV trends by a few years, so 2024–2025 is when we finally saw the big 2020–2022 new‑EV cohorts start hitting the secondary market in force. That’s created a very different pricing environment heading into 2026.
Key used EV trends going into 2026
Inventory is up, prices have normalized, and battery health is the new odometer.
1. Inventory keeps building
Every wave of new‑EV sales eventually becomes used‑car inventory. The strong 2021–2023 new‑EV cohorts are now three to five years old, feeding a rapidly expanding used‑EV supply, especially in coastal markets and EV‑heavy metros.
2. Prices are down from the peak
After the pandemic run‑up, most pricing indexes show used EV values off 20–30% from peak levels, with some early long‑range models and luxury EVs down even more. That’s painful for first owners, but a major opportunity if you’re buying in 2026.
3. Battery health is the differentiator
Two similar‑looking used EVs can have very different remaining range. Vehicles with documented battery health and fast‑charging performance are holding value better than those with unknown histories or heavy DC‑fast‑charging usage.
Where Recharged fits in
Policy, incentives, and how they’re shaping 2026
EV sales statistics don’t move in a vacuum, policy and incentives have been central drivers. In the U.S., the 2022 Inflation Reduction Act (IRA) reshaped federal tax credits starting in 2024, tying eligibility more tightly to North American assembly and battery‑component sourcing. Several states, led by California, continue to push toward 2035 gasoline‑vehicle phase‑out targets, while others are re‑evaluating their timelines.
Key policy levers influencing 2024–2026 EV sales
1. Federal clean‑vehicle tax credit changes
Starting in 2024, stricter sourcing rules narrowed the list of new EVs eligible for the full $7,500 credit. That pulled some demand forward into mid‑2025 and contributed to a softer Q4 once consumers realized fewer models qualified.
2. Growing focus on leases
Automakers leaned into leasing as a way to preserve full credits even on models that didn’t qualify for retail purchase credits, because commercial‑use rules are more flexible. That helped keep monthly payments competitive and supported volumes, especially on mainstream crossovers.
3. State‑level mandates and incentives
California and a handful of other states continue to ratchet up zero‑emission vehicle requirements for automakers. At the same time, some local purchase rebates have been scaled back, pressuring entry‑level EV economics in certain regions.
4. Charging‑infrastructure spending
Federal and state spending on public charging under programs like NEVI has been slower to materialize than originally advertised. That hasn’t stopped adoption in urban and suburban cores, but it has tempered rural and road‑trip confidence for some buyers.
Watch for policy headlines in 2026
What EV sales statistics mean if you’re buying used
So what does all of this look like from the driver’s seat of a used‑EV shopper in 2026? In one word: leverage. High global volumes, Chinese cost pressure, more brands fighting for share, and a maturing policy environment have combined to hand serious bargaining power to well‑informed used‑EV buyers.
Four takeaways for used‑EV buyers in 2026
How to turn market statistics into practical steps at the dealership, or online.
1. Wide price bands by model year
The same nameplate can span a wide price range depending on battery size, software features, and trim. Use recent sales data and tools like the Recharged Score’s pricing benchmark to understand where a specific car sits within that band.
2. Trim and range matter more than you think
In a softened market, shoppers gravitate toward value. Long‑range trims and models with heat pumps, fast DC charging and driver‑assist suites tend to hold value better than base models, even if the sticker difference was modest when new.
3. Battery proof beats guesswork
With early EVs now 6–8 years old, documented battery health is becoming the equivalent of maintenance records on a gasoline car. A strong third‑party battery report can justify a higher price, or help you negotiate a weaker pack down.
4. Don’t fear out‑of‑region shopping
Because EV adoption has been uneven, you may find better inventory or pricing by shopping outside your immediate metro. Recharged supports nationwide delivery, so you can buy where the data says value is best, not just where you live.
How to read EV sales charts like a pro
EV sales graphics can look intimidating, but a handful of questions will tell you whether a chart is actually useful for your decision, or just noise. Here’s how to decode what you’re seeing.
Checklist: Questions to ask about any EV sales chart
1. Is it volume, share, or growth rate?
A chart showing "20% growth" doesn’t tell you whether that’s on 200,000 units or 2 million. Volume tells you scale, share tells you penetration, and growth rate tells you momentum. You need all three for context.
2. BEV only, or BEV + PHEV?
Some statistics include only battery‑electric vehicles; others lump in plug‑in hybrids. That’s fine as long as you know which it is, don’t compare a BEV‑only number to a BEV+PHEV number and draw big conclusions.
3. Calendar year vs. rolling 12 months
An ugly Q4 can make a calendar‑year bar look weaker even if the rolling 12‑month trend is still strong. Look for charts that show multiple years and, ideally, quarterly detail.
4. Regional mix and currency effects
Global averages hide big differences between China, Europe, and the U.S. A price or volume trend in yuan‑denominated Chinese data may not translate directly into U.S. used‑EV prices.
5. How old is the data?
A 2022 chart might still be circulating in 2026 search results. Always check the time stamp. At Recharged, our pricing benchmarks and Recharged Score Reports are refreshed using the latest available transaction data.
Frequently asked questions: EV sales statistics 2026
EV sales statistics 2026: common questions
Key takeaways for EV buyers and sellers in 2026
The top‑line story from EV sales statistics in 2026 is simple: the global transition is still moving forward, but the easy growth is over. China has raced ahead, Europe is settling into a steady groove, and the U.S. is working through a bumpy middle chapter where incentives, interest rates and consumer expectations don’t always line up.
- Global EV volumes hit new highs in 2024 and 2025, with more than 20 million electric cars sold worldwide last year.
- China now accounts for roughly half of new EV sales, Europe for close to a third, and the U.S. for a high‑single‑digit share with room to grow.
- Used EV inventory in 2026 is deeper and more diverse than ever, and prices are meaningfully lower than a few years ago.
- Battery health, charging performance and trim content are emerging as the main drivers of used‑EV value, not just odometer readings.
- Data‑driven tools like the Recharged Score, fair‑market pricing and expert EV support turn a noisy market into a clear set of choices.
If you’re buying or selling a used EV this year, lean on the data but don’t drown in it. Look at direction (up, down, or flat) more than single‑month headlines, focus on how a specific vehicle’s battery and equipment stack up, and don’t be afraid to comparison‑shop beyond your ZIP code. Recharged is built for exactly that reality, connecting you with verified‑battery used EVs, transparent pricing, financing, trade‑in options and nationwide delivery, so you can let the numbers work for you instead of against you.