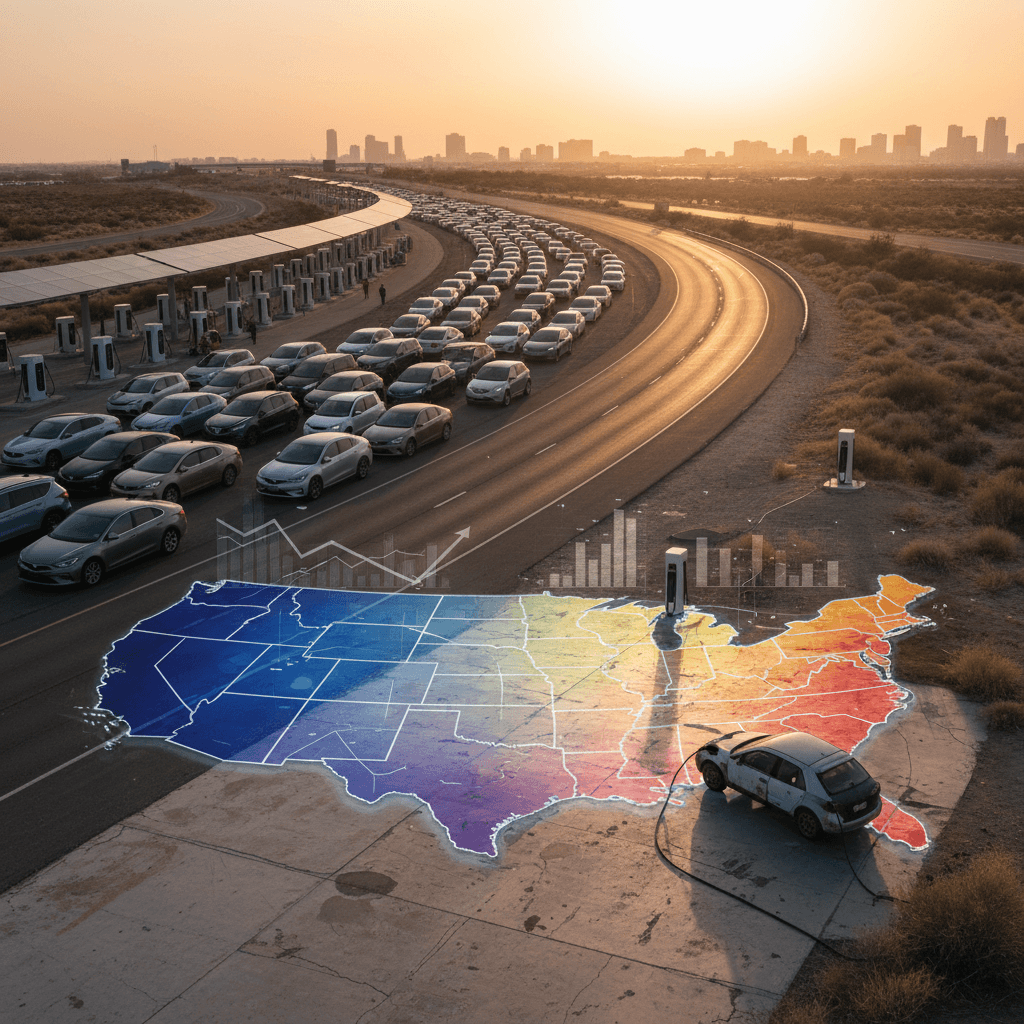
When you start comparing the EV adoption rate by state, you see two very different Americas. In a handful of states, one in four new vehicle registrations is electric. In others, EVs are still a rounding error. Understanding where your state sits on that curve can tell you a lot about incentives, charging availability, and even how easy it will be to buy or sell a used electric vehicle.
What we mean by “EV adoption rate”
Why EV adoption varies so much by state
The gap between the highest and lowest EV adoption states is enormous. In 2024, a small group of states saw more than 20% of new light‑duty vehicle registrations go to EVs, while others were still in the low single digits. That divergence isn’t random, it comes down to policy, income, housing, climate, and even local politics.
Four big forces behind state EV adoption
Why some states are years ahead of others
State policies & incentives
States that stack their own rebates, HOV access, and utility programs on top of federal incentives tend to see EV market share jump faster.
Charging infrastructure
Dense public charging, especially DC fast charging, reduces range anxiety and makes EVs viable for apartment dwellers and road‑trippers.
Income & energy prices
Higher household incomes and high gasoline prices both nudge shoppers toward EVs, especially when electricity remains relatively cheap.
Housing & commuting patterns
States with more single‑family homes and garages make home charging easier. Rural driving and long commutes can slow adoption unless fast charging is widespread.
A quick note on the data
How to read “EV adoption rate by state” data
When you search for EV adoption rate by state, you’ll see several overlapping, but slightly different, numbers. To make sense of it, it helps to separate three ideas: market share, total fleet, and per‑capita adoption.
1. Market share of new registrations
This is the percentage of new vehicles registered that are EVs over a period (for example, calendar year 2024). It’s the best thermometer for how quickly your state is moving toward electrification.
2. Total EVs on the road
This is the total count of registered EVs in a state. Big states like California, Florida, and Texas dominate this ranking simply because they have more vehicles overall.
3. EVs per resident or per vehicle
Per‑capita metrics, like EVs per 10,000 residents, show how common EVs are in everyday life. Smaller states with strong policies can look surprisingly strong here.
How to use these numbers as a shopper
Where the U.S. sits overall
Top EV states by market share of new registrations
If you look at the EV share of new registrations, a cluster of states clearly leads the pack. By late 2024, four jurisdictions saw more than 20% of new light‑duty registrations go to EVs, with another dozen above 10%. That’s more than double the national average in many cases.
Why California doesn’t always show up as #1

States with the most EVs on the road
Market share tells you how quickly buyers are switching right now. Total EVs on the road tell you where EVs are already everywhere you look. As of late 2024, the usual suspects dominate total registrations: big, populous states with strong economies.
States with the largest EV fleets (through late 2024)
Total registered battery‑electric vehicles, not including plug‑in hybrids.
| Rank | State | Approx. EV registrations | Share of U.S. EV fleet |
|---|---|---|---|
| 1 | California | ≈1.25 million | ≈35% |
| 2 | Florida | ≈255,000 | ≈7% |
| 3 | Texas | ≈230,000 | ≈6% |
| 4 | Washington | ≈150,000 | ≈4% |
| 5 | New Jersey | ≈135,000 | ≈4% |
| 6 | New York | ≈130,000 | ≈4% |
| 7 | Illinois | ≈100,000 | ≈3% |
| 8 | Georgia | ≈92,000 | ≈3% |
| 9 | Colorado | ≈90,000 | ≈3% |
| 10 | Arizona | ≈85,000 | ≈2–3% |
These figures are rounded snapshots based on registration data available through late 2024.
How this affects your day‑to‑day experience
Fastest-growing EV states since 2020
Another way to look at EV adoption by state is growth rate: where have EV registrations multiplied the fastest in the last few years? Here, some surprise names jump out, states that started small but are catching up quickly.
States where EV registrations exploded between 2020 and 2024
Good news if you live in a “late bloomer” state
Low-adoption states and what’s holding them back
At the other end of the spectrum, a handful of states still have extremely low EV adoption rates. In some, EVs make up well under 5% of new registrations and an even smaller share of vehicles on the road. These states tend to cluster in parts of the Midwest, Great Plains, and Deep South.
- Lower population density and long average trip distances, which make drivers nervous about range and charging access.
- Fewer state‑level incentives, or even added EV registration fees that blunt the impact of federal tax credits.
- Limited public charging, especially DC fast charging, outside a few interstate corridors.
- Housing stock that skews toward older homes and fewer garages, making home charging upgrades more complicated.
- Cultural and political skepticism toward new technologies or climate policies, which filters into consumer sentiment.
Why very low adoption can be a risk factor
How EV adoption tracks with charging infrastructure
It’s hard to say whether chargers cause EV adoption or vice versa, but they clearly move together. States with high EV adoption almost always have stronger public charging networks, especially on highways and around population centers. Conversely, in many low‑adoption states, the map of fast chargers still looks like a few thin lines along interstates.
Public charging is racing to keep up
Look at growth, not just today’s map
What EV adoption by state means if you’re buying used
So what does all this mean when you’re staring at listings for used Teslas, Chevy Bolts, Hyundai IONIQ 5s, or Ford F‑150 Lightnings? In practice, your state’s EV adoption rate shapes your experience in four big ways: availability, pricing, support, and incentives.
Four ways state EV adoption affects used buyers
From inventory to resale value
1. Inventory depth
High‑adoption states simply have more EVs returning from leases and first owners. That gives you more choice on trims, colors, and mileage, and more leverage on price.
2. Pricing dynamics
In some early‑adopter markets, strong demand can keep used EV prices firm. In emerging markets, limited local demand can create bargains, but may also make resale slower later.
3. Service & repair options
States with more EVs tend to have more technicians trained on high‑voltage systems and more dealers comfortable diagnosing EV issues.
4. Incentives & ownership costs
Many high‑adoption states offer extra perks, rebates, reduced tolls, discounted off‑peak charging, that improve your total cost of ownership.
Where Recharged fits in
Ready to find your next EV?
Browse VehiclesChecklist: Matching your state to the right used EV
You can’t change your state’s adoption rate overnight, but you can choose a used EV that fits your local reality. Use this checklist as you narrow down models and quotes.
State‑by‑state EV fit checklist
1. Identify your state’s adoption tier
Is your state more like California and Colorado (high adoption), North Carolina and Florida (mid‑tier), or Mississippi and North Dakota (low adoption)? A quick search of “EV market share [your state]” will point you in the right direction.
2. Match range to local charging
In a high‑adoption state with dense DC fast charging, a shorter‑range urban EV might be fine. In a low‑adoption state with long rural drives, lean toward models with <strong>longer EPA range and faster DC charging</strong>.
3. Consider home charging reality
If you have a garage or dedicated driveway, adding a Level 2 charger usually isn’t hard. If you rely on street parking or an older apartment, prioritize states and cities with strong public charging, and EVs that charge quickly on DC fast chargers.
4. Check incentives beyond the federal credit
State and utility rebates can change the math dramatically. Some states with high adoption offer thousands of dollars in extra incentives; others have added annual EV fees instead.
5. Think about resale timing
If you’re in a low‑adoption state and expect to sell in a few years, choosing a model with national appeal, and verifiable battery health, can help when you go to trade in or list the vehicle.
6. Use third‑party battery health data
Battery condition matters more than odometer miles. A <strong>Recharged Score battery health report</strong> gives you objective data that doesn’t depend on how EV‑savvy your local dealer is.
EV adoption rate by state: FAQ
Frequently asked questions about EV adoption by state
Bottom line: Use state EV adoption as a smart shopping signal
When you zoom out, the story of EV adoption rate by state is a story of uneven progress. A handful of Western and Northeastern states have made EVs mainstream, with one in four new vehicles plugging in. Others are just starting to move beyond early adopters. That gap shapes everything from how many used EVs you can test‑drive this weekend to how easy it is to find a fast charger on a road trip.
You don’t control state policy, but you can control how informed your next purchase is. Start by understanding where your state sits on the adoption curve, then choose a used EV whose range, charging speed, and support network fit your reality. And whether you buy locally or tap nationwide inventory, a Recharged Score Report with verified battery health and pricing transparency can give you the confidence to go electric on your own terms.