If you’ve looked at used electric car prices lately, you’ve probably had whiplash. A few years ago, Teslas were resale champs. Today, many EVs are losing 50–65% of their value in five years, and some models fare far worse than others. Understanding the electric car depreciation rate by model is the difference between getting an incredible deal and buying someone else’s bad bet.
Quick take
Why EV depreciation looks so weird right now
Before we compare specific models, it helps to understand why EV depreciation in 2024–2026 looks so extreme. You’re seeing the hangover from a few overlapping trends: aggressive new-EV discounts, fast-moving tech, shifting incentives, and uneven demand.
- Rapid price cuts on new EVs: Tesla and others have slashed new prices, instantly dragging down used values of the same models.
- Tax credits and incentives: A $7,500 credit on a new EV compresses what buyers are willing to pay for a similar used one.
- Tech obsolescence: Older EVs with shorter range, slower charging, or weaker software age faster than an equivalent gas car.
- Policy and sentiment swings: Headlines about charging access, insurance costs, or an “EV slowdown” spook some shoppers, hurting resale even when the underlying cars are solid.
Don’t overreact to 2023–2025
How electric car depreciation is actually measured
Most of the data you see online refers to 5‑year depreciation: the percentage difference between a car’s original MSRP and its typical resale value five years later, assuming average mileage and normal condition.
Key depreciation concepts in plain English
These terms show up in every EV value conversation
Depreciation rate
The percentage of value lost over a time period. For example, a 60% 5-year depreciation rate means a $50,000 car is worth about $20,000 after five years.
Retained value
The flip side of depreciation. A car that loses 55% of its value retains 45%. Higher retained value usually means stronger demand and a healthier used market.
Battery SOH
Battery State of Health (SOH) measures how much usable capacity remains versus new. A healthy battery slows depreciation; a weak one accelerates it.
How to read the numbers
5-year electric car depreciation by model
Different data providers disagree on exact percentages, but they broadly agree on which models are resale winners and which are laggards. The table below summarizes typical 5‑year depreciation ranges using 2024–2025 market data from CarEdge, iSeeCars, and other valuation tools, rounded for clarity.
Approximate 5-year depreciation by popular EV model
Estimated loss from original MSRP after five years, assuming average mileage and normal condition. These are directional ranges, not guaranteed outcomes.
| Model | Segment | Typical 5-Year Depreciation | Typical 5-Year Value Retained | Notes |
|---|---|---|---|---|
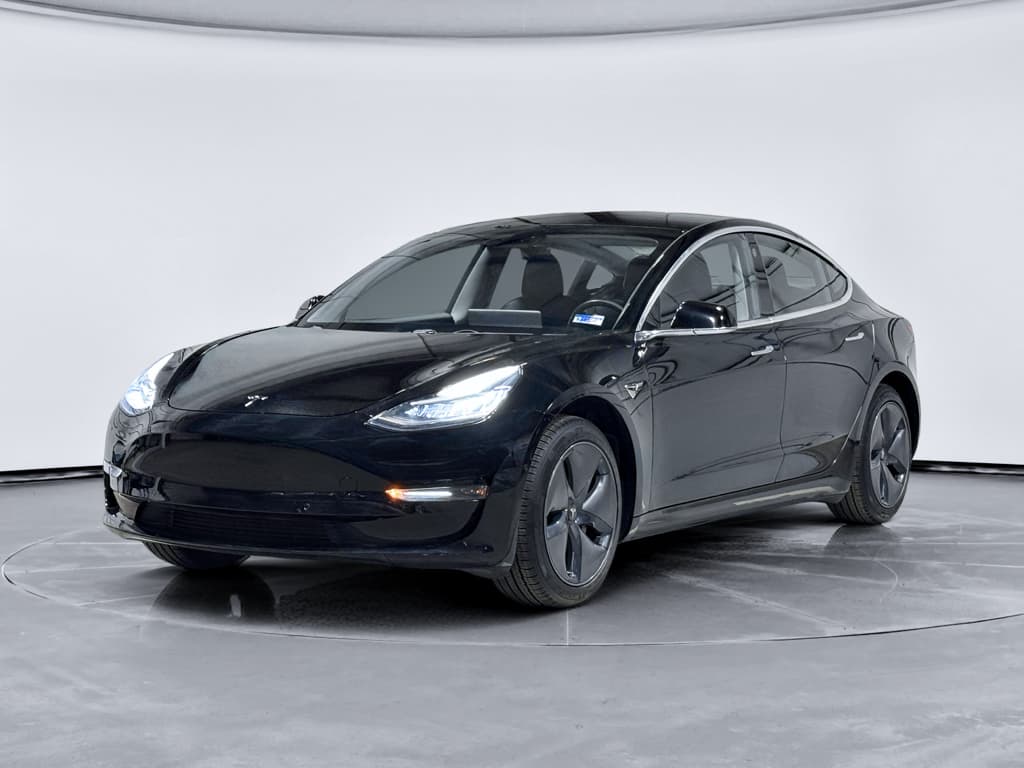
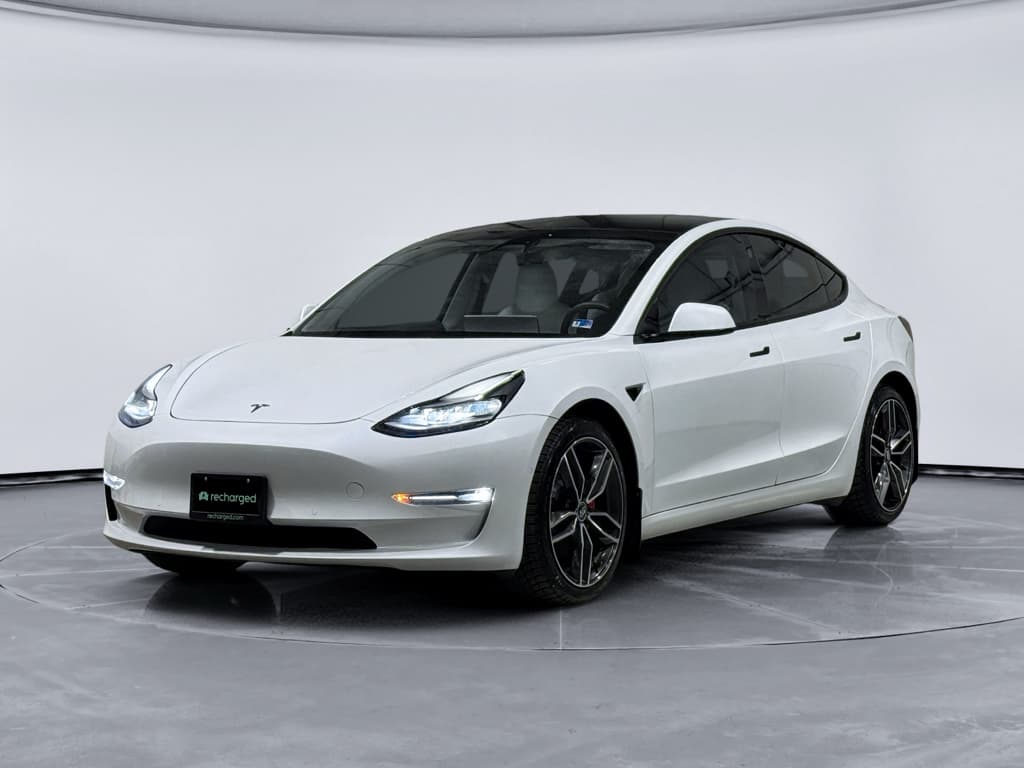
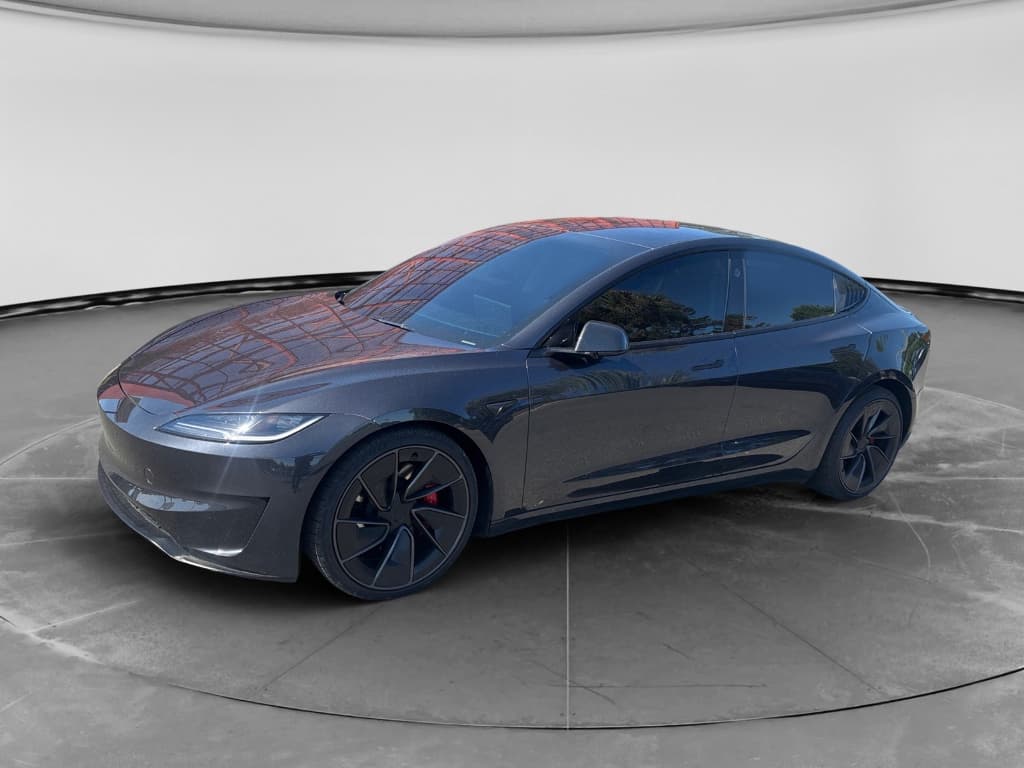
| Tesla Model 3 | Compact sedan | ~55–62% | ~38–45% | Once a resale star; now closer to a BMW 3 Series in depreciation. |
| Tesla Model Y | Compact SUV | ~60–62% | ~38–40% | Strong demand but heavy price cuts have hit used values. |
| Tesla Model S | Large luxury sedan | ~63–70% | ~30–37% | Early luxury EV; tech ages fast and demand is niche. |
| Tesla Model X | Large luxury SUV | ~65–70% | ~30–35% | High MSRP and limited audience equal steep dollar losses. |
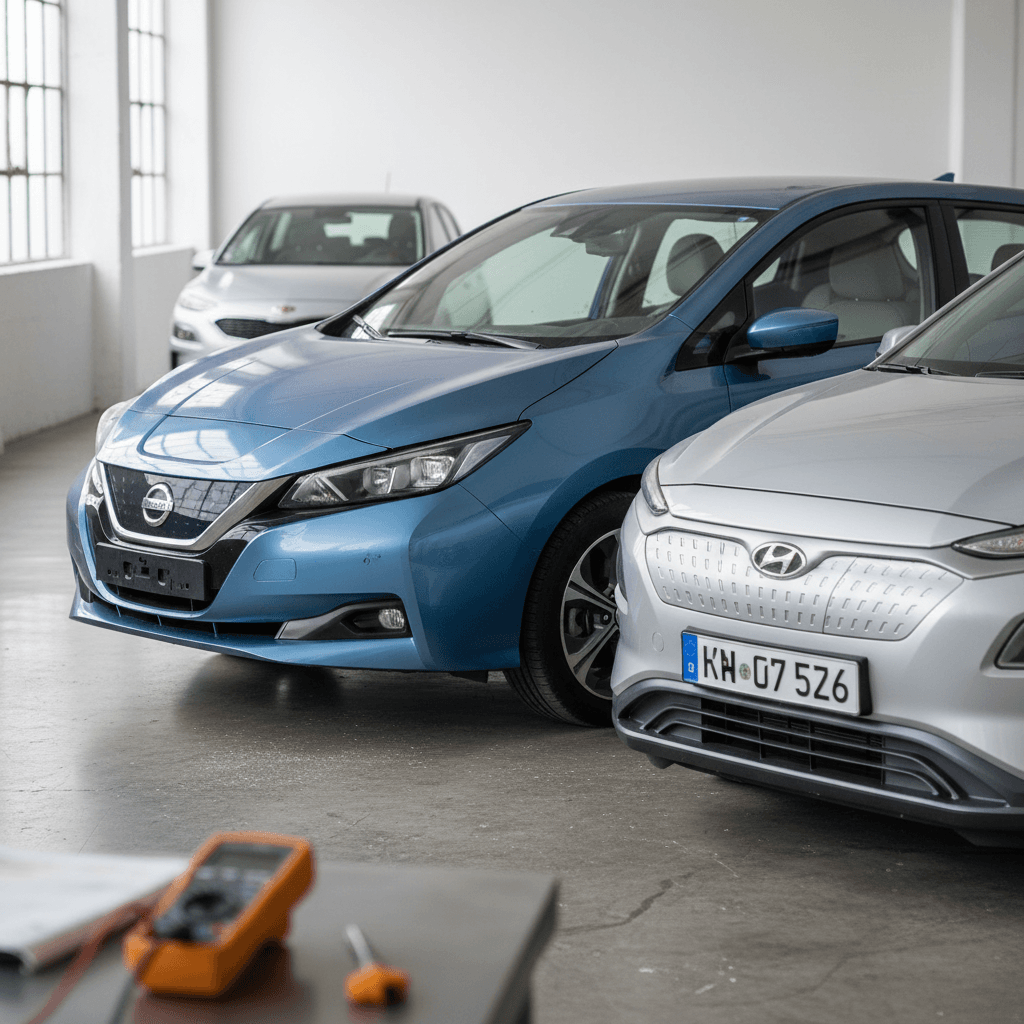
| Nissan Leaf (2nd gen) | Compact hatchback | ~64–70% | ~30–36% | Shorter range and limited fast charging hurt resale. |
| Chevy Bolt EV / EUV | Compact hatchback | ~60–68% | ~32–40% | Excellent efficiency, but GM’s exit from Bolt doesn’t help confidence. |
| Hyundai Ioniq 5 | Compact SUV | ~58–62% | ~38–42% | Modern platform and fast charging help it hold value better than early EVs. |
| Kia EV6 | Compact SUV | ~58–62% | ~38–42% | Similar story to Ioniq 5: solid tech, reasonable resale. |
| Ford Mustang Mach‑E | Compact SUV | ~58–65% | ~35–42% | Mixed reviews and incentive swings make depreciation variable by trim. |
| Volkswagen ID.4 | Compact SUV | ~60–66% | ~34–40% | Some quality and software complaints have weighed on values. |
| Rivian R1T | Electric pickup | ~48–52% | ~48–52% | One of the few EVs currently holding roughly half its value after five years. |
| Luxury EVs (EQS, I‑Pace, etc.) | Luxury sedan/SUV | ~65–75% | ~25–35% | Small buyer pool and rapid tech change lead to heavy losses. |
Use these numbers to compare models to each other, not as a precise forecast for a specific car.
Why the ranges are wide
Electric car models that hold value best
Even in a choppy market, some EVs clearly depreciate less. They combine modern tech, solid range, and strong brand pull, plus, in a few cases, genuine scarcity.
Current standouts for slower EV depreciation
These models typically keep more of their value relative to peers
Rivian R1T
Rivian’s electric pickup often retains around 50% of its value after five years. Trucks in general depreciate less, and the R1T is still a relatively rare, desirable product.
Tesla Model 3
The Model 3 is no longer magic, but compared with older Leaf/Bolt-style EVs it still holds a higher floor thanks to the Supercharger network, efficiency, and software support.
Hyundai Ioniq 5 / Kia EV6
Modern 800‑V charging, competitive range, and good reviews help these Korean crossovers avoid the worst EV depreciation, even if they still lose more than a comparable hybrid.
What “good” EV depreciation looks like today
Models that depreciate fastest, and why
On the other end of the spectrum, certain EVs routinely show up in “worst depreciation” studies. The common thread isn’t that they’re bad cars; it’s that they’re mismatched to what the second owner wants.
- Nissan Leaf: Limited range (especially on early cars) and weaker highway fast charging mean many shoppers see it as a city-only tool. Result: ~65–70% depreciation over five years is common.
- Chevy Bolt EV/EUV: Excellent efficiency, but small size and GM’s decision to end the Bolt line have chilled some buyers. Typical five‑year depreciation is in the 60–68% range.
- Early luxury EVs (Jaguar I‑Pace, Audi e‑tron/Q8 e‑tron, Mercedes EQS): High MSRPs, fast-moving tech, and a thin used‑EV luxury audience combine for 70%+ depreciation in many analyses.
- Big-battery Teslas (Model S/X): Large, expensive EVs are the hardest to resell in a softer market. Losses of ~65–70% over five years aren’t unusual.
The trap: chasing the cheapest EV
Battery health: the quiet driver of depreciation
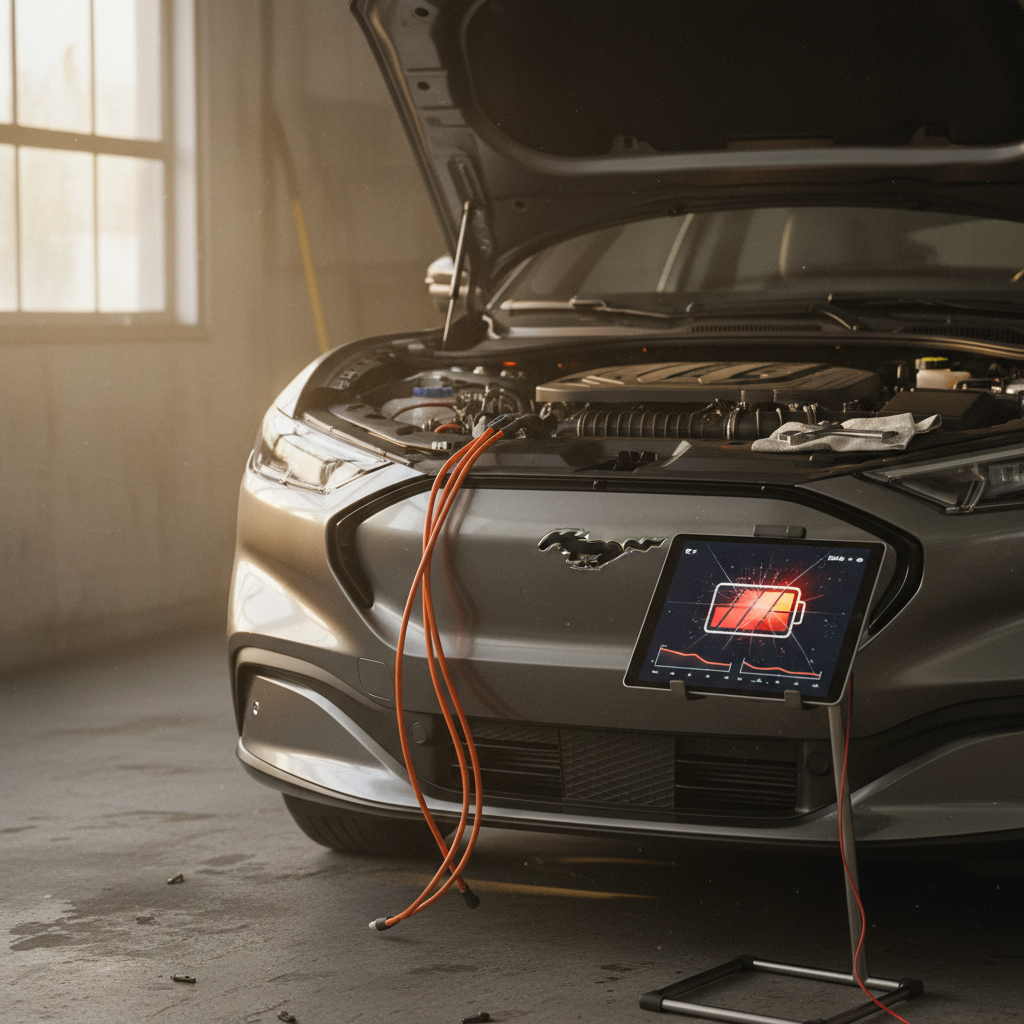
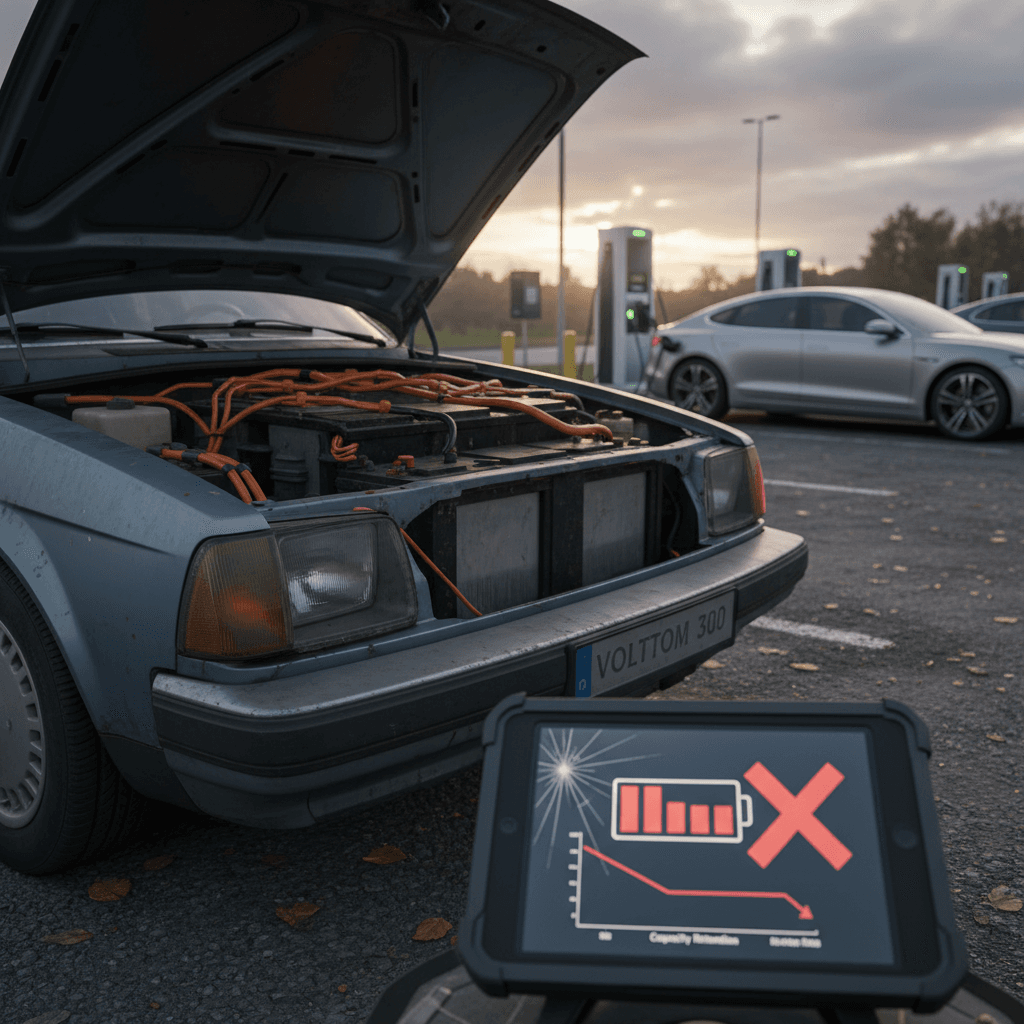
Underneath all these model‑by‑model numbers is the variable that really moves the needle: battery State of Health (SOH). Two identical EVs on paper can have wildly different resale value if one has 90% remaining capacity and the other has 75%.
Battery health benchmarks that matter for resale
Always demand a battery report
How to use depreciation data when shopping used
Knowing that a Nissan Leaf tends to depreciate faster than an Ioniq 5 is helpful, but it’s just the starting point. To buy smart, you need to pair model‑level patterns with the specifics of the car in front of you.
Turn depreciation data into a smarter used EV purchase
1. Start with the right segment
Choose a model that fits how you actually drive, commuter hatchback, family crossover, or long‑range road‑trip rig. A cheap city EV will feel expensive if you’re constantly stretching its range.
2. Compare model‑level depreciation
Use tables like the one above to narrow your search to models that don’t fall off a cliff. Aim for EVs in the <strong>50–60% five‑year loss</strong> band rather than the 65–75% group unless the price truly justifies it.
3. Target the depreciation “sweet spot”
For many EVs, the worst depreciation happens in the first 3–4 years. Buying a car that’s already taken that hit, then keeping it 5+ years, can deliver excellent cost‑per‑mile economics.
4. Dig into battery and charging
Look beyond odometer and trim. Verify battery SOH, check whether DC fast charging has been heavily used, and understand the charging standard (CCS vs. NACS) and adapter situation for your region.
5. Check software and support
Some older EVs have lost key features or updates. Confirm that navigation, charging integrations, and driver‑assist features still work and that the automaker hasn’t quietly abandoned the platform.
6. Run total cost of ownership
Factor in insurance, electricity, and maintenance alongside depreciation. A model that loses value faster might still be a win if it’s inexpensive to run and you buy it at the right point in its curve.
Market-level depreciation
Studies that say “EVs lose 59% in five years” or “Model Y depreciates 60%” are talking about averages. They’re useful for comparing models and understanding the big picture but they can’t see your specific car’s options, history, or battery health.
Car-level reality
Individual cars deviate a lot. A meticulously maintained, low‑mileage Leaf with a healthy battery can be a better buy than a harder‑used Ioniq 5 that’s lived on DC fast charging. That’s why verified condition reports matter more with EVs than with almost any other vehicle type.
Where Recharged fits into the depreciation puzzle
Electric car depreciation isn’t just an abstract chart, it's baked into every price tag on the used market. At Recharged, we try to make that invisible math visible, so you can decide whether a given EV is a bargain or a liability.
How Recharged helps you navigate EV depreciation
Tools and services built specifically for used electric vehicles
Recharged Score Report
Every car on Recharged includes a Recharged Score with verified battery health, charging history where available, and fair‑market pricing. You see exactly how condition and SOH influence value.
Fair, market-based pricing
Our pricing engine looks at real EV resale data, by model, trim, mileage, and battery health, so you’re not overpaying for a model that’s known to depreciate faster.
Specialist guidance
Recharged EV specialists can walk you through trade‑offs between a lower‑priced, faster‑depreciating model and a higher‑priced EV that’s likely to hold value better over your ownership window.
Ready to find your next EV?
Browse VehiclesLooking to swap into a different EV?
FAQ: Electric car depreciation by model
Common questions about EV depreciation rates
Bottom line: how to play EV depreciation to your advantage
Electric car depreciation is more brutal at the model level than a lot of early hype suggested, but that’s exactly why the used EV market is so attractive right now. If you understand which models lose value fastest, how battery health reshapes the curve, and where the 3–5‑year “sweet spot” lies, you can let the first owner subsidize a big chunk of your cost of ownership.
Treat depreciation rates by model as your map, and tools like a Recharged Score battery report as your compass. When you combine the two, you’re in a much better position to decide whether that tempting used EV is a smart long‑term partner, or someone else’s expensive experiment.