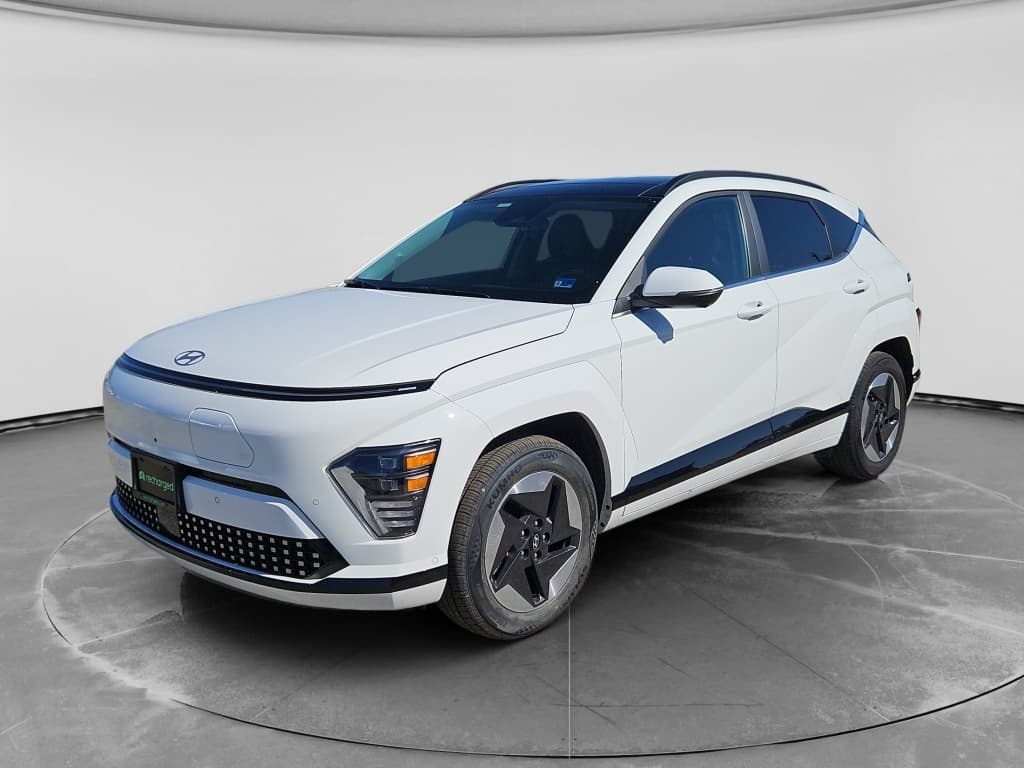
You can fall in love with the wheels, the tech, even the color. But with a used electric vehicle, the battery health report is where the real story lives. If you’ve ever stared at a State of Health percentage, a bunch of kWh numbers, or rainbow-colored range bars and thought, “Is this good or bad?”, this guide is for you.
What this guide will give you
Why EV battery health reports matter, especially for used EVs
In a gas car, you worry about rust, oil changes, and transmission noises. In an EV, the single most expensive component is the high‑voltage battery pack. A typical modern EV battery is designed to last for many years, and large studies now show average capacity loss around 2–3% per year in normal use. That’s encouraging, but it also means two similar‑looking used EVs can have very different remaining range and value.
- Battery health affects how far you can actually drive between charges.
- It influences charging time, less healthy batteries can be slower or less predictable.
- It is a major driver of resale value and future repair risk.
- Battery warranties are usually tied to a minimum State of Health (SoH), often around 70% after about 8 years or a set mileage.
Don’t rely on the dash alone
Anatomy of an EV battery health report
Different brands, apps, and dealers format reports differently, but the key ingredients are surprisingly consistent. When you open an EV battery health report, whether it’s from a manufacturer tool, a third‑party service, or a marketplace like Recharged, look for these building blocks:
Core pieces of an EV battery health report
Most reports contain the same story told in slightly different ways.
State of Health (SoH) %
Usable vs. nominal capacity (kWh)
Estimated range
Age, mileage & history
Warranty status
Method & conditions

Pro tip: Save the PDF
Step 1: Start with State of Health (SoH %)
State of Health (SoH) is the headline number on almost every EV battery report. It’s a percentage that compares the battery’s current usable capacity to its original capacity when new. A brand‑new pack is typically near 100% SoH; as it ages and cycles, that number drifts down over time.
Quick SoH benchmarks for used EVs
These are general guidelines, always cross‑check with age, mileage, climate, and warranty terms for the specific vehicle.
| SoH % | What it usually means | How to think about it when buying |
|---|---|---|
| 95–100% | Very light use or recent pack; sometimes a recent replacement or software recalibration. | Expect near‑new range. Great sign on a newer car; investigate history on an older one, why is it this high? |
| 90–94% | Typical for a healthy EV after a few years with normal mileage. | Very normal. Range loss is modest. For most buyers, this is a sweet spot. |
| 85–89% | Still healthy, but degradation is noticeable vs. new. | Expect some range loss. Fine if price reflects it and your daily driving is modest. |
| 80–84% | Approaching what many OEMs consider the lower bound of “normal”. | Worth a closer look at price, history, and warranty. Good candidate if your range needs are modest and deal is strong. |
| 70–79% | Near or below typical warranty threshold for many brands. | This is where you ask hard questions: age, usage, climate, and whether a warranty claim might be possible or already attempted. |
| Below 70% | Usually considered end‑of‑life for automotive use by many standards. | Only acceptable with very heavy discounts or specific uses. Expect noticeably reduced range and possible warranty or repair conversations. |
Use this table as a starting point, not a verdict. Some models age a bit faster or slower than average.
Watch out for one number in isolation
Step 2: Translate kWh into real-world range
SoH tells you how the battery compares to new. What you really care about, though, is how far you can drive. That means turning capacity numbers, kWh, into miles or kilometers you can actually use.
1. Read the capacity numbers
Most reports show at least two capacity figures:
- Nominal capacity (kWh): The pack’s original rated capacity when new (for example, 77 kWh).
- Usable or measured capacity (kWh): What the report estimates the pack can store now (for example, 67 kWh).
If a pack started at 77 kWh and is now at 67 kWh usable, that’s roughly 87% SoH.
2. Convert to approximate range
To turn capacity into range, divide usable kWh by the car’s typical efficiency:
- Usable kWh ÷ consumption (kWh/100 miles or Wh/mile) ≈ range.
- If the report provides its own range estimate, note the assumptions: highway vs. city, temperature, and speed.
Don’t be surprised if the report’s estimate is lower than the original window sticker range, most real‑world numbers are.
A quick back‑of‑the‑napkin formula
Step 3: Compare SoH to warranty thresholds
Battery warranties are your safety net. Most automakers promise the pack will retain around 70% of its original capacity for about 8 years or 100,000–150,000 miles (exact numbers vary by brand). Your report helps you see where this particular car sits on that curve.
Reading SoH in the context of a typical battery warranty
Use this to frame risk and potential upside, not as legal advice. Always verify the actual warranty terms for the VIN you’re considering.
| Scenario | What you might see on the report | What to ask or consider |
|---|---|---|
| Young car, high SoH | Car is 3 years old with 92% SoH and plenty of warranty left. | Low risk. Ask for typical range in your climate and confirm there’s no active battery‑related recalls. |
| Midlife car, mid‑80s SoH | Car is 6 years old, 60,000 miles, 86% SoH. | Pretty normal. Confirm warranty end date and make sure price reflects the modest range loss. |
| Older car, SoH near 70% | Car is 7–8 years old with SoH around 72–75%. | You’re close to the warranty threshold. Ask if any warranty claims have been made or denied, and consider range needs carefully. |
| SoH below threshold, still under time/mileage | Car is 6 years old with SoH at 65%. | This may qualify for a warranty remedy depending on the brand and testing conditions. Get the OEM documentation and consider having a dealer run its own test. |
Even if SoH is above the warranty floor today, a rapidly declining pack could cross that line before the warranty expires.
How Recharged handles warranty information
Step 4: Read the usage and charging history
Two EVs can have the same SoH today but very different futures, depending on how they were used. When a report includes usage and charging patterns, that’s gold, because it helps you judge how the pack was treated.
What history clues tell you about a battery’s past
You’re looking for consistent, moderate use, not a life of extremes.
Mileage & driving pattern
Fast‑charging habits
Climate exposure
Depth of discharge
Green flags in the history
Step 5: Understand accuracy and limitations
Here’s the part most glossy reports bury in the fine print: no battery health measurement is perfectly precise. Many reports are based on the car’s internal Battery Management System (BMS) and can swing several percentage points depending on temperature, recent driving, and how recently the pack was fully charged and discharged.
Common sources of fuzziness
- Temperature: Cold packs can temporarily show lower capacity; tests done on a frigid morning may under‑represent true SoH.
- Recalibration: Some EVs adjust their SoH estimate after a full, slow charge from low to high state‑of‑charge, changing the reported value by several points.
- Rounding & disclaimers: Manufacturers sometimes round SoH to the nearest 5% or attach ±10% disclaimers to service‑center printouts.
How to protect yourself as a buyer
- Ask when and how the test was performed and at what mileage.
- Be cautious with borderline results, an 80% reading with ±5% accuracy could be anywhere from 75–85% in reality.
- Use the report alongside a thorough used EV inspection checklist, not as the only data point.
One report ≠ lifetime guarantee
How Recharged’s battery health report (Recharged Score) fits in
Recharged is built around a simple promise: make used EVs as transparent and understandable as possible. Every vehicle sold through Recharged includes a Recharged Score Report, which rolls battery health, pricing, and vehicle condition into one clear picture, so you’re not trying to decode a random service‑center printout by yourself.
What you’ll typically see in a Recharged Score battery section
The goal is to turn technical data into real‑world meaning.
Verified battery SoH & capacity
Real‑world range estimates
Fair‑market pricing context
Warranty & risk snapshot
Plain‑language summary
EV‑specialist support
Ready to find your next EV?
Browse VehiclesAsk questions, humans allowed
Quick checklist: Questions to ask the seller
Whether you’re looking at a private‑party car, a traditional dealer lot, or a vehicle listed on a digital marketplace, come armed with questions. A good seller, or a platform that stands behind its cars, won’t be rattled by them.
Battery report questions you should always ask
1. Can I see the full battery health report, not just a summary?
Ask for a PDF or clear screenshots showing SoH %, usable/nominal kWh, test date, mileage at test, and any range estimates. If they won’t share it, that’s a red flag.
2. Who performed the test, and when?
Manufacturer tool, third‑party service, or marketplace report? Was it done last week or last year? You want something recent and traceable.
3. What was the SoH when you bought it (if known)?
A big drop in a short time may point to hard use, harsh climate, or an emerging issue. A stable SoH over years is reassuring.
4. How was the car typically charged?
Look for primarily home or workplace Level 2 charging, with occasional fast‑charging for trips. Daily DC fast‑charging in hot weather is harder on packs.
5. What kind of daily range did you get in real life?
The owner’s own experience, commute length, winter behavior, road‑trip stories, helps you connect the report’s numbers to actual use.
6. Is the battery still under factory warranty, and until when?
Get the exact date and mileage, and, if possible, written confirmation of the warranty terms tied to that VIN.
Where Recharged makes this easier
FAQ: Reading EV battery health reports
Frequently asked questions about EV battery health reports
If you’ve read this far, you’re already ahead of most used‑car shoppers. You know that an EV battery health report isn’t a mystery file; it’s simply a story about capacity, range, and risk. Learn to read SoH alongside kWh, range estimates, and warranty terms, ask smart questions about history and testing conditions, and choose a seller who’s willing to be transparent. Whether you buy through Recharged or somewhere else, understanding that report is how you turn a used EV from a question mark into a confident daily companion.