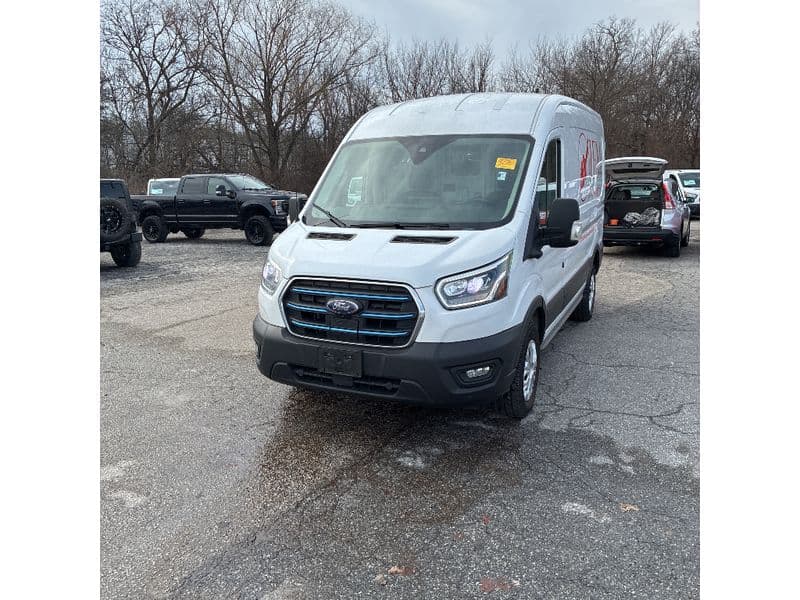
If you operate delivery vans or service trucks, you’ve almost certainly asked whether a Ford E-Transit will actually be cheaper to run than a gas or diesel Transit. With tight margins and volatile fuel prices, the Ford E-Transit vs gas Transit cost savings question isn’t academic, it’s about whether electrifying your fleet will pay off in the real world.
Why this comparison matters now
Why fleets are comparing E-Transit vs gas Transit now
Until recently, the E-Transit carried a noticeable upfront premium over a comparable gas Transit. Today, Ford positions the 2025 E-Transit so that purchase prices are similar to, or even slightly lower than, some gas configurations once incentives are applied. That flips the conversation from “Can I afford the EV?” to “How fast will the EV pay itself back through lower running costs?”
- Fuel prices are volatile and hard to budget around.
- Urban delivery fleets are facing stricter emissions and noise regulations.
- Electric vans increasingly match gas Transits on payload, volume, and upfit options.
- Customers and municipalities are pressuring contractors to decarbonize their operations.
The result: a lot of fleets are sitting down with spreadsheets to compare cost per mile, per route, and per vehicle‑year for E-Transit vs gas Transit. The rest of this guide walks through that math with realistic, U.S.-focused assumptions.
Quick answer: How much can an E-Transit save?
Typical E-Transit vs gas Transit cost deltas (per mile)
Rule-of-thumb takeaway
Key assumptions behind the cost comparison
No two fleets are identical, but you can only make useful comparisons if you’re explicit about your assumptions. Here’s the baseline we’ll use to compare Ford E-Transit vs gas Transit cost savings, with numbers tuned for a U.S. operator in 2025–2026.
Baseline assumptions: E-Transit vs gas Transit cost model
You can adjust these numbers for your local fuel and electricity rates, or for your specific routes.
| Parameter | E-Transit (electric) | Gas Transit |
|---|---|---|
| Energy efficiency | ~1.7–2.0 mi/kWh (mixed use) | 12–14 mpg (loaded, urban/suburban) |
| Battery / tank | 89 kWh usable pack | 25 gal tank (typical) |
| Annual miles | 20,000 mi (delivery / service van) | 20,000 mi |
| Electricity price | $0.13/kWh depot or home; $0.35/kWh public DCFC | n/a |
| Gasoline price | n/a | $3.75/gal (U.S. average over time) |
| Ownership horizon | 5 years / 100,000 miles | 5 years / 100,000 miles |
Assumptions are meant to be realistic but conservative for mixed urban/suburban duty cycles.
Your numbers will differ
Energy cost per mile: electricity vs gasoline or diesel
Energy is usually the single biggest operating‑cost line item you can influence. The core question: what does it cost to move a loaded Transit one mile on electrons versus on gasoline (or diesel, for some configurations)?
E-Transit energy cost per mile
Using the mid‑range of our efficiency assumption, 1.8 mi/kWh in mixed duty, you need about 0.56 kWh per mile.
- At $0.13/kWh depot or home rate: 0.56 × $0.13 ≈ $0.07/mi.
- At $0.20/kWh (some commercial tariffs): ≈ $0.11/mi.
- At $0.35/kWh public DC fast charging: ≈ $0.20/mi.
The key is how often you pay that expensive public charging rate versus your cheaper depot or home rate.
Gas Transit fuel cost per mile
Real‑world, loaded Ford Transit vans doing stop‑and‑go routes often see 12–14 mpg. Let’s take 13 mpg as a middle‑of‑the‑road figure.
- At $3.50/gal: $3.50 ÷ 13 ≈ $0.27/mi.
- At $3.75/gal (our baseline): ≈ $0.29/mi.
- At $4.25/gal (common in many metros): ≈ $0.33/mi.
Unlike electricity, you have almost no control over when or how you buy fuel, which makes budgeting harder.
Three charging/fueling scenarios for the same 20,000‑mile van
How E‑Transit vs gas Transit cost savings change with your charging mix
Depot‑dominated E‑Transit
90% depot AC, 10% public DCFC
- Weighted energy cost ≈ $0.09/mi
- Gas Transit at $0.29/mi
- Savings: ≈ $0.20/mi
- Annual savings @ 20k mi: ≈ $4,000
Mixed charging E‑Transit
60% depot, 40% public DCFC
- Weighted energy cost ≈ $0.13–0.14/mi
- Gas Transit at $0.29/mi
- Savings: ≈ $0.15–0.16/mi
- Annual savings @ 20k mi: ≈ $3,000
Fuel‑only gas Transit
100% fuel, no electrification
- Fuel cost locked at ≈ $0.29/mi
- No flexibility to shift to off‑peak energy
- Sensitivity to geopolitical or seasonal price spikes
- Annual fuel cost @ 20k mi: ≈ $5,800
Focus on cost per route, not just per mile
Maintenance and downtime savings with E-Transit
Ford and other commercial‑EV operators consistently report that electric vans cost substantially less to maintain than their internal‑combustion equivalents. There’s no engine oil, no spark plugs or timing belts, far fewer moving parts, and much less brake wear thanks to regenerative braking.
What disappears when you move from gas Transit to E‑Transit?
Where 30–40% lower scheduled maintenance costs come from
Gas Transit maintenance loads
- Regular oil and filter changes
- Spark plugs, ignition components
- Complex exhaust and emissions systems
- Transmission fluid services and repairs
- Higher brake wear in stop‑and‑go use
E‑Transit maintenance profile
- No engine oil, plugs, or exhaust system
- Simple single‑speed drive unit
- Fewer fluids and moving parts
- Regenerative braking extends pad life
- Software diagnostics can prevent failures
Ford has publicly guided that E‑Transit scheduled maintenance costs are around 40% lower than a comparable gas Transit over eight years or 100,000 miles. In practical fleet budget terms, if you currently spend $0.10–$0.12 per mile maintaining older gas Transits (including wear items), seeing that drop into the $0.06–$0.08/mi range with an E‑Transit is realistic.
Downtime is part of maintenance cost
Total cost of ownership: 3–8 year view
When fleets talk about Ford E‑Transit vs gas Transit cost savings, what they really care about is total cost of ownership (TCO): all‑in cost to buy, fuel, maintain, and eventually dispose of the asset. Let’s walk a simple 5‑year, 100,000‑mile example using conservative assumptions and ignoring tax credits to keep it clean.
Illustrative 5‑year, 100,000‑mile TCO comparison
Very simplified example, excluding financing, taxes, insurance, and incentives. Use this as a directional reference, not a quote.
| Cost component | E-Transit | Gas Transit |
|---|---|---|
| Purchase price (net of discounts) | $60,000 | $58,000 |
| Energy/fuel (@ 20k mi/yr) | ≈$9,000 ($0.09/mi) | ≈$29,000 ($0.29/mi) |
| Maintenance & repairs | ≈$7,000 | ≈$11,000 |
| Total 5‑year operating cost | ≈$16,000 | ≈$40,000 |
| Total 5‑year TCO | ≈$76,000 | ≈$98,000 |
| TCO advantage over 5 yrs | E‑Transit ahead by ≈ $22,000 | , |
Assumes similar purchase prices for new E‑Transit and gas Transit after discounts.
What if you qualify for incentives?
Real-world use cases: last‑mile, service vans, shuttles
The Ford E‑Transit doesn’t magically save money in every scenario. It’s optimized for short‑to‑medium, repeatable routes with depot parking. Here’s how the Ford E‑Transit vs gas Transit cost savings tend to shake out across common use cases.
Where E‑Transit economics are strongest
Matching your duty cycle to the right powertrain
Urban last‑mile delivery
Typical profile:
- 80–120 miles/day
- Stop‑and‑go urban traffic
- Overnight depot parking
Why E‑Transit wins: Regenerative braking boosts efficiency, fuel costs plummet vs 12 mpg gas vans, and noise/air‑quality benefits can matter in city contracts.
Field service & trades
Typical profile:
- 50–150 miles/day
- Lots of idling in gas vans
- Home‑based or mixed depot parking
Why E‑Transit often wins: No idling penalties, strong torque for stop‑start work, and predictable overnight charging at techs’ homes or at a small depot.
Shuttles & campus transport
Typical profile:
- Fixed loops, 8–14 hrs/day
- Access to central depot
- Low‑speed, predictable routes
Why E‑Transit can work: High utilization makes fuel savings add up quickly, though you must design charging windows carefully.
Where gas Transit still makes more sense

Charging and infrastructure: the hidden variable
Any honest Ford E‑Transit vs gas Transit cost comparison has to grapple with charging infrastructure. A depot charging project is capital‑intensive up front, but it’s also what unlocks the lowest electricity rates and the highest uptime.
Charging and infrastructure checklist for fleet planners
1. Map your routes and dwell time
Before buying a single E‑Transit, audit where your vans park and for how long. Can you guarantee 8+ hours parked at a depot or home most nights? If not, how many mid‑day charging opportunities exist?
2. Start with Level 2 where possible
For typical Transit duty cycles, a bank of 40–80A Level 2 chargers will be cheaper and easier to deploy than an overbuilt DC fast‑charging yard. Reserve DCFC for edge cases and route recovery.
3. Work with your utility early
Demand charges, transformer upgrades, and new service drops can make or break your business case. Engage the utility during planning, not after you’ve ordered vehicles.
4. Consider load management software
Smart charging platforms can stagger E‑Transit charging to avoid peaks, keep you under a demand threshold, and prioritize vehicles that need to be ready first thing in the morning.
5. Assign the right routes to EVs
Don’t just replace vans 1:1. Give E‑Transits the most predictable, urban, medium‑distance routes and leave edge‑case routes to gas Transits, at least in the early years of your transition.
Leverage existing parking patterns
Used E-Transit vs used gas Transit cost dynamics
Most of the public discussion focuses on brand‑new vans, but many small fleets and owner‑operators shop used. That’s where the economics start to look even more interesting, and where Recharged focuses its marketplace.
Used gas Transit realities
- Older, high‑mileage vans often come with rising maintenance and repair costs.
- Fuel efficiency tends to degrade over time, especially if maintenance was deferred.
- Residual values can be unpredictable as cities move toward low‑emission zones.
You may buy a used gas Transit cheaply, but you’re also inheriting the tail end of its cost curve.
Used E‑Transit considerations
- Energy and brake‑related maintenance remain low if the battery is healthy.
- Battery health becomes the critical variable, capacity loss reduces useful range.
- Earlier‑build E‑Transits may have shorter range than the latest 89 kWh models.
That makes a transparent battery health report more important than odometer alone when assessing a used E‑Transit’s true value.
How Recharged can de‑risk used E‑Transits
How to run the E-Transit vs gas Transit numbers for your fleet
You don’t need a PhD in transport economics to decide whether E‑Transit cost savings pencil out for your operation. You do need to be methodical and honest about your duty cycles. Here’s a simplified process you can follow.
Step‑by‑step TCO playbook
For small fleets (1–20 vans)
Export 12–24 months of odometer and fuel card data for your Transits.
Calculate average miles per day and per year for each van, plus your true mpg.
Estimate E‑Transit efficiency (mi/kWh) from similar duty cycles, then compute energy cost per mile at your local rates.
Pull your last few years of maintenance invoices to estimate maintenance cost per mile.
Model a 5‑year scenario with 2–3 E‑Transits on your best‑fit routes and compare to keeping those routes in gas vans.
For larger fleets (20+ vans)
Segment routes by length, geography, and parking patterns; identify the 25–40% that are most E‑Transit‑friendly.
Engage your utility and a charging‑infrastructure partner to estimate depot costs and tariffs.
Use a fleet‑grade TCO calculator (or work with a consultant) that can handle depreciation, incentives, and demand charges.
Run sensitivity analyses for fuel price spikes and different electricity mixes.
Pilot a small E‑Transit cohort, track real‑world data for 6–12 months, then scale based on results.
Don’t forget financing and resale
FAQ: Ford E-Transit vs gas Transit cost savings
Common questions about E‑Transit vs gas Transit economics
Bottom line: When does E-Transit make financial sense?
Take away the marketing gloss and the Ford E‑Transit vs gas Transit cost savings story is surprisingly straightforward. If your vans run a lot of miles on repeatable routes, sleep where you can install reasonably priced charging, and you’re disciplined about route assignment, the E‑Transit tends to win decisively on operating cost, and increasingly, on upfront price as well.
Where fleets get into trouble is assuming EVs will pencil out on every route, or skipping the hard work of modeling their actual duty cycles. Do that homework, and you’ll quickly see where E‑Transits are a slam‑dunk, where gas Transits should stick around a while longer, and how fast a phased transition can improve your cost per mile.
If you’re exploring used E‑Transits or looking to rotate older gas Transits out of service, Recharged can help you benchmark real‑world TCO, pre‑qualify for EV‑friendly financing, value your trade‑ins, and source vans with verified battery health. That’s how you turn an abstract E‑Transit vs gas Transit cost comparison into a concrete competitive advantage.