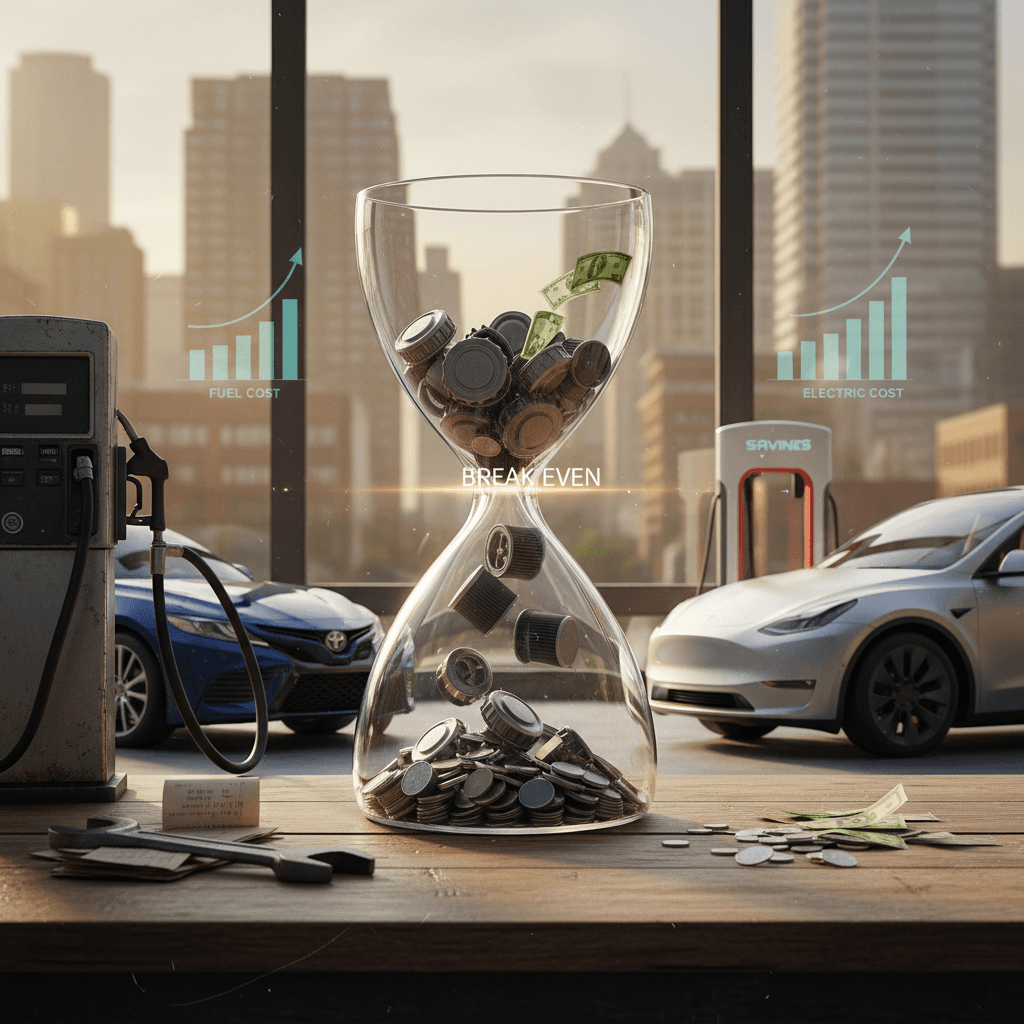
When people talk about the break even point gas vs electric car, they’re really asking one question: “After paying more up front for an EV, when do the lower running costs finally outweigh what I would’ve spent on a gas car?” In 2026, with higher electricity prices in some states and federal EV tax credits being phased out, the answer depends a lot on how far you drive, how you charge, and whether you buy new or used.
Quick definition
How the break-even point works for gas vs electric cars
To understand when an electric car “pays for itself,” you need to compare total cost of ownership (TCO), not just sticker price or fuel cost. That means looking at all the big pieces over a given time horizon, usually five to ten years:
- Upfront cost (purchase price, taxes, fees, minus any remaining incentives)
- Financing costs (interest) if you’re using a loan
- Fuel vs electricity costs over the years you’ll own the car
- Maintenance and repair costs
- Insurance and registration (often similar but can differ by model)
- Resale value or trade-in value when you’re done with the car
The break-even point is the moment on a timeline where the running-cost savings of an EV (cheaper fuel and maintenance) have offset any higher purchase price and financing. For many drivers in the U.S. right now, that’s somewhere between 3 and 7 years, depending on whether you buy new or used and how much you drive.
Typical 2026 U.S. cost gaps: EV vs gas
Why used EVs often break even faster
2026 baseline assumptions: fuel, electricity, and maintenance
Break-even math is only as good as the assumptions behind it. For this guide we’ll use ballpark 2026 U.S. averages that line up with recent Recharged analyses and national data. Your local numbers will vary, but these give you a solid starting point.
Baseline 2026 assumptions for break-even comparisons
Average 2026 U.S. costs and efficiencies used in our gas vs electric break-even examples.
| Factor | Gas car assumption | Electric car assumption | Notes |
|---|---|---|---|
| Energy efficiency | 26 mpg | 30 kWh/100 mi (3.3 mi/kWh) | Typical compact/midsize crossover class |
| Energy price | $3.15/gal gasoline | $0.17/kWh home electricity | Close to recent U.S. national averages |
| Fuel/energy cost per mile | ≈$0.12–0.13/mi | ≈$0.04–0.05/mi | EV saves ~8–9¢ per mile on energy alone |
| Maintenance cost per mile | ≈$0.08–0.09/mi | ≈$0.04–0.05/mi | EVs often spend about half as much on maintenance |
| Combined running cost | ≈$0.20–0.22/mi | ≈$0.08–0.10/mi | Total per‑mile savings ≈10–13¢ for the EV |
Local prices for gasoline and electricity can change your break-even point by several years, so adjust these to match your utility bill and nearby gas stations.
Public fast charging changes the math

A simple example: when an EV breaks even vs a gas car
Let’s take a straightforward scenario using those assumptions. You’re choosing between two similar compact crossovers, one gas, one electric.
Example comparison: new gas crossover vs new electric crossover
Illustrative 2026 example with a moderate EV price premium and typical U.S. driving.
| Item | Gas crossover | Electric crossover |
|---|---|---|
| Purchase price (out‑the‑door) | $30,000 | $37,000 |
| Price difference | , | + $7,000 |
| Miles driven per year | 15,000 mi | 15,000 mi |
| Energy + maintenance cost/mi | ≈$0.21/mi | ≈$0.09/mi |
| Annual running costs | ~$3,150 | ~$1,350 |
| Annual savings with EV | , | ≈$1,800/year |
Actual prices will vary by model and incentives, but this simple example shows how the running-cost savings stack up.
In this example, the EV costs about $7,000 more up front but saves roughly $1,800 per year in energy and maintenance if you drive 15,000 miles a year. That means a simple payback time of:
- $7,000 ÷ $1,800/year ≈ 3.9 years
- At 15,000 miles per year, that’s roughly 60,000 miles to break even.
Simple break-even formula
Miles to break even by driving habit
Your driving pattern is one of the biggest levers in the break even point gas vs electric car. High‑mileage drivers hit break even much sooner because they rack up running‑cost savings faster.
How long until break even?
Assuming a $6,000 EV price premium and 10¢ per‑mile savings vs gas
Light driver
8,000 mi/year (typical city commuter)
- Annual savings ≈ $800
- Break even ≈ 7.5 years
- Total miles to break even ≈ 60,000
Average driver
12,000 mi/year (close to U.S. average)
- Annual savings ≈ $1,200
- Break even ≈ 5 years
- Total miles to break even ≈ 60,000
Heavy driver
20,000 mi/year (long commute or road‑warrior)
- Annual savings ≈ $2,000
- Break even ≈ 3 years
- Total miles to break even ≈ 60,000
If you drive a lot, EV economics are hard to beat
How purchase price and financing shift the math
The other major variable in your break-even calculation is how big the purchase price gap is between the gas and electric options, and how you pay for that difference.
1. Upfront price gap
If the EV is only $3,000 more than the gas car, and you still save about 10¢ per mile, you’re looking at break even around 30,000 miles. That’s barely two to three years for many households.
On the other hand, a large EV SUV that’s $10,000 more than a comparable gas SUV may need 80,000–100,000 miles before it comes out ahead, especially if it’s less efficient or you charge on expensive public networks.
2. Financing and interest
When you finance, you’re not just paying the higher sticker; you’re paying interest on that difference. A higher EV price can mean:
- Higher monthly payment for the same loan term
- Or a longer loan term to keep the payment similar
That doesn’t erase the EV’s fuel and maintenance savings, but it can stretch the time to break even by months or years compared with paying cash.
Use pre‑qualification to see the real gap
Used EV vs used gas: where break-even gets easier
New‑car economics get most of the headlines, but the break-even point gets especially interesting in the used market, where Recharged operates. Here’s why:
- Early buyers have already absorbed the steepest EV depreciation, so price gaps vs used gas cars are usually smaller than new‑vs‑new.
- You still get most of the EV’s lifetime fuel and maintenance savings between, say, 40,000 and 150,000 miles.
- Many used EVs still carry transferable battery and powertrain warranties, which helps manage long‑term risk.
Illustrative used‑car break-even scenarios
Simplified 5‑year ownership comparisons with smaller used price gaps
Scenario A: Tight price gap
Used gas sedan: $18,000
Used EV sedan: $20,000
- Price difference: $2,000
- Per‑mile savings: ≈10¢
- Break even: ≈20,000 miles
- At 12,000 mi/year, that’s under 2 years
Scenario B: Larger EV, bigger gap
Used gas SUV: $22,000
Used EV SUV: $26,000
- Price difference: $4,000
- Per‑mile savings: ≈8¢ (less efficient, some paid fast charging)
- Break even: ≈50,000 miles
- At 15,000 mi/year, that’s a bit over 3 years
Where Recharged fits in
Other factors: insurance, battery, and resale value
Fuel and maintenance dominate most break-even calculations, but they’re not the whole story. A few other factors can move your personal gas vs electric break-even point by thousands of dollars either way.
Key wild cards that affect break even
Insurance premiums
Some EVs cost a bit more to insure because of higher repair costs or limited repair networks; others are similar to their gas equivalents. If your EV quote is several hundred dollars more per year than the gas car, that nudges the break-even point out a bit.
Battery health and warranty
A well‑cared‑for EV battery can easily last well past 150,000 miles, but neglect and extreme climates accelerate degradation. Buying a used EV with a <strong>verified battery health report</strong> and remaining warranty protection reduces the risk of a big out‑of‑pocket battery expense that would blow up your break-even math.
Resale or trade‑in value
If EV resale values soften relative to gas cars in your market, that eats into some of your savings; if gas vehicles fall out of favor or face new restrictions, the EV may hold value better. Always think in terms of <strong>net cost (purchase minus resale)</strong>, not just the price you pay today.
Charging access and pricing
Home charging at a reasonable residential rate is the key to big fuel savings. If you’re stuck with expensive public charging or high time‑of‑use peaks, your electricity cost per mile might narrow the gap with gasoline by several cents.
Don’t assume every EV breaks even
Checklist: figure out your own break-even point
If you want to move beyond generic averages and find your break-even point gas vs electric car, you don’t need a PhD in economics. A simple spreadsheet or even a notepad gets you 90% of the way there.
Step-by-step break-even calculation
1. Pick two real vehicles
Choose one gas car and one EV that you would genuinely buy. Don’t compare a compact hatchback to a luxury electric SUV; keep class, size, and feature levels similar.
2. Note all-in purchase prices
Use out‑the‑door numbers (price, taxes, fees) minus any incentives you’re actually eligible for. For used EVs on Recharged, use the listed price and factor in any trade‑in or instant offer for your current car.
3. Estimate your annual mileage
Check your current odometer and maintenance records, or use your navigation app’s yearly driving summary. Be honest: the more you drive, the faster an EV usually breaks even.
4. Calculate per-mile fuel and electricity costs
Look up the EPA or manufacturer efficiency numbers (mpg and kWh/100 mi), then plug in your local gas price and electric rate from your last bill. Compute cost per mile for each vehicle.
5. Add rough maintenance costs
Use a simple rule of thumb: maybe <strong>8–9¢/mi</strong> for a typical gas car and <strong>4–5¢/mi</strong> for a typical EV, unless you have better data for your specific models. Add this to your fuel or electricity cost per mile.
6. Compute per-mile savings and break-even mileage
Subtract the EV’s per‑mile running cost from the gas car’s. Divide the EV’s higher purchase price by that per‑mile savings to get your <strong>break-even mileage</strong>. Then divide by your annual mileage to convert it into <strong>years to break even</strong>.
Sanity‑check against your ownership horizon
FAQ: break even point gas vs electric car
Frequently asked questions about EV vs gas break even
Bottom line: when an EV makes financial sense
The break even point gas vs electric car isn’t a single number carved in stone. It’s a moving target shaped by your purchase price, how far you drive, where and how you charge, and how long you keep your cars. For a typical U.S. driver who can charge at home and buys a reasonably priced EV, especially on the used market, breaking even within 3–6 years and 40,000–80,000 miles is a realistic expectation, even in a post‑tax‑credit world.
If you’re cross‑shopping specific used EVs and gas cars, the simplest way to cut through the noise is to compare real vehicles with real prices, not averages. That’s where Recharged can help: every EV we list comes with transparent pricing, a Recharged Score battery health report, and support from EV specialists who live and breathe this math. Run your numbers, sanity‑check them against how long you actually keep cars, and you’ll know whether your next electric car is a financial win, not just a technological one.