If you’re eyeing a used Tesla Model S, or wondering when to sell yours, the Tesla Model S depreciation curve over 5 years is one of the most important numbers you can understand. It tells you who’s paying for the steepest years of value loss and who is swooping in at the sweet spot.
Quick take
Why the Tesla Model S depreciation curve matters
Depreciation is the single biggest cost of owning a new luxury car, and the Tesla Model S is no exception. Electricity is cheap, maintenance is modest, but the dollars you never get back when you sell, or trade in, dwarf most other line items.
- For a new‑car buyer, the first 3–5 years are where most of the value evaporates.
- For a used‑car buyer, those same years are where the bargains live.
- For a current owner, timing your sale against the curve can mean thousands of dollars gained or lost.
Understanding the Model S depreciation curve helps you answer three questions: When should I buy? How long should I keep it? And when is the best time to sell or trade? The answers look very different for a $95,000 new Plaid versus a $32,000 six‑year‑old Long Range.
How much value a Tesla Model S typically loses in 5 years
Let’s start with the big picture. Across the broader car market in the U.S., a typical new vehicle loses around 50–60% of its value in the first five years. Luxury vehicles usually do worse. Recent EV‑specific research and pricing data show that the Tesla Model S often loses about 60–70% of its original MSRP over 5 years, putting its 5‑year resale value around 30–40% of what it cost new.
Model S depreciation snapshot (typical ranges)
On paper, that sounds brutal if you’re the first owner. But viewed from the other side, it means that around year five, a Model S can deliver serious performance, range, and tech for roughly one‑third of its original sticker, which is exactly why the used market for these cars has become so active.
Depreciation isn’t one-size-fits-all
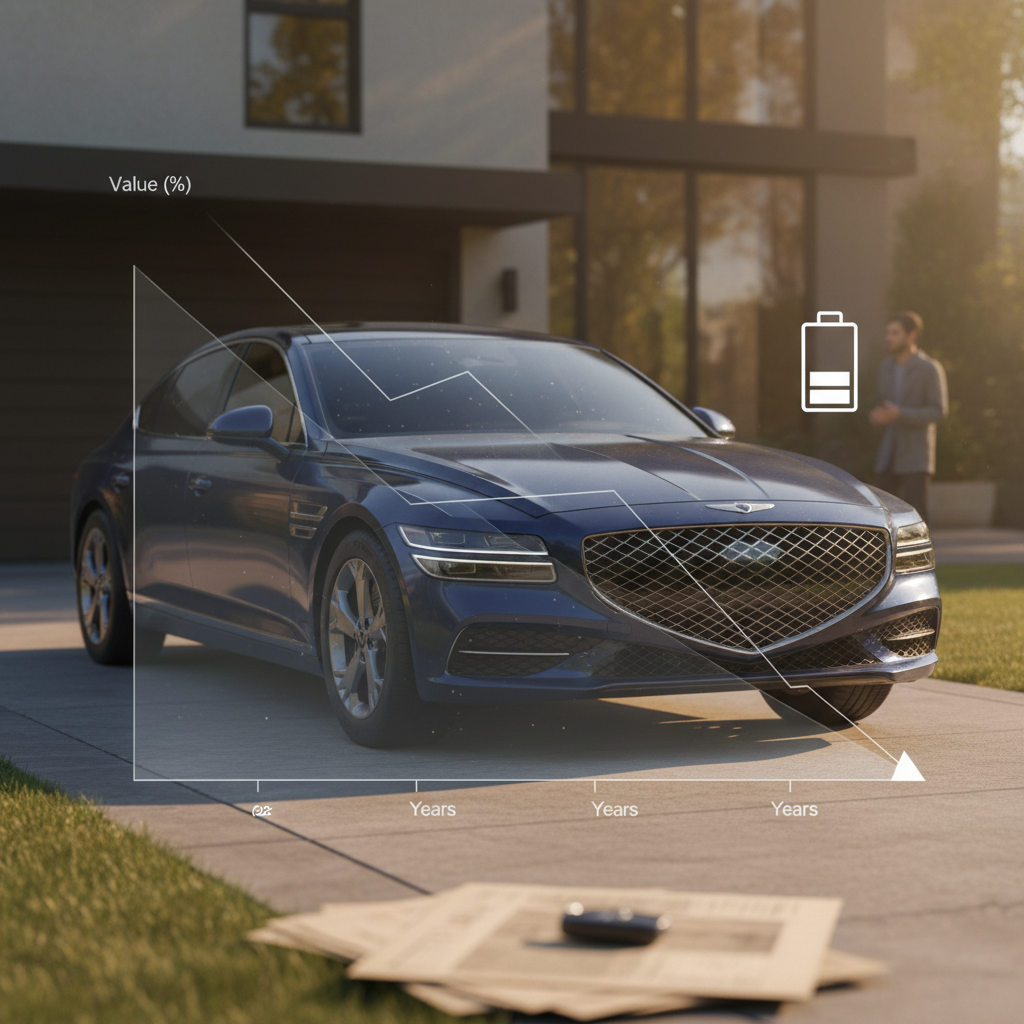
An example Tesla Model S 5‑year depreciation curve
To make this real, let’s walk through a simplified example. We’ll use a hypothetical $95,000 new Tesla Model S (close to real‑world transaction prices for higher trims in recent years) and map a reasonable 5‑year curve based on current market behavior.
Sample 5‑year Tesla Model S depreciation curve
Illustrative curve for a $95,000 new Model S in normal market conditions, assuming 12,000 miles per year and no major accidents.
| Year of ownership | Approx. value | Total value lost | % of original price lost | What’s happening |
|---|---|---|---|---|
| New (Month 0) | $95,000 | , | , | You’ve just taken delivery at full MSRP (or close to it). |
| Year 1 | $65,000–$72,000 | $23,000–$30,000 | ~25–32% | Early‑adopter premium and rapid tech changes create a steep first‑year drop, similar to other luxury sedans. |
| Year 2 | $55,000–$62,000 | $33,000–$40,000 | ~35–42% | More inventory hits the used market; newer software and hardware revisions appear. |
| Year 3 | $45,000–$52,000 | $43,000–$50,000 | ~45–53% | Depreciation slows a bit, but luxury EV demand is sensitive to rates and incentives. |
| Year 4 | $37,000–$45,000 | $50,000–$58,000 | ~53–61% | Out of basic warranty for earlier years; buyers start pricing in repair‑cost risk. |
| Year 5 | $30,000–$38,000 | $57,000–$65,000 | ~60–68% | Car has moved firmly into value territory; still quick, but no longer “new tech.” |
Actual resale will vary by trim, mileage, battery health, options, and local market.

This example curve reflects where the market has largely landed after Tesla’s price cuts, a flood of off‑lease vehicles, and more competition. In practice, you’ll see individual cars above or below these numbers, but the overall shape of the curve, steep early, then softening, holds up well.
Think in percentages, not just dollars
How the Model S 5‑year curve compares to other EVs
The Model S used to be an outlier in a good way, early on, it held value unusually well. As the EV market has matured and Tesla has cut prices on new cars, the script has flipped. Large luxury EVs now tend to be some of the fastest‑depreciating vehicles on the road over a 5‑year span.
Where the Model S sits among 5‑year depreciation curves
A simplified look at typical 5‑year depreciation patterns by segment in today’s market.
Mainstream gas sedan
Typical 5‑year loss: ~50–55% of MSRP.
Think Toyota Camry or Honda Accord. Solid demand and broad appeal keep resale predictable.
Mainstream EV (Model 3/Y, etc.)
Typical 5‑year loss: ~50–60%.
Compact and midsize EVs have improved and now track close to the overall market average in many cases.
Large luxury EV (Model S, I‑PACE, etc.)
Typical 5‑year loss: ~60–70%.
High MSRPs, rapid tech change, and a smaller buyer pool combine to create steeper curves.
Within that luxury‑EV bucket, the Model S sits near the top for 5‑year depreciation. That sounds negative, but it’s precisely why a used Model S can deliver so much car for the money. The key is to let someone else ride the steepest part of the curve.
Key factors that shape your personal depreciation curve
No two Tesla Model S sedans depreciate exactly the same way. Market averages hide a lot of spread, and your car’s curve is shaped by a handful of big variables.
What pushes a Model S above or below the 5‑year average?
Trim, year, and original MSRP
Plaid and Performance cars start higher, so they can both lose more in dollars and still look affordable used. Refresh years (like the major interior update) can also reset buyer expectations and push older examples down.
Mileage and usage pattern
A five‑year‑old Model S with 45,000 miles lives on a different curve than one with 110,000 miles. High‑mileage cars often trade primarily on price, not options.
Battery health and fast‑charging history
A pack that still tests close to its original capacity preserves value; one that shows significant degradation, or has lived on DC fast charging, will pull the curve down.
Accidents and title history
Structural damage, airbag deployment, or a branded title can carve tens of percent off resale and move your individual curve far below the average.
Software and feature set
Options like Enhanced Autopilot or Full Self‑Driving, premium audio, and recent software updates can keep a car more desirable and help it sit above the median curve.
Macro market swings
Interest rates, fuel prices, tax credits, and Tesla’s own new‑car pricing changes can all shove the entire Model S curve up or down over just a few months.
Why today’s curve is a little weird
Buying used: where the Model S depreciation curve gets attractive
If you’re a shopper, your job is simple: avoid paying for the steep left‑hand side of the curve. With the Model S, that usually means skipping the first couple of years and focusing instead on cars that are roughly three to seven years old, depending on your budget and risk tolerance.
Years 1–2: Still for early adopters
A one‑ or two‑year‑old Model S is still absorbing a lot of depreciation each year. You may save versus brand new, but you’re effectively stepping into the second half of the steepest part of the curve.
These cars work if you want the latest hardware and are comfortable being the person who eats that remaining early drop.
Years 3–6: The value zone
By year three, a large chunk of the original price has already come out of the car. Somewhere between years three and six, the curve flattens, and you can often buy at 35–55% of original MSRP while enjoying most of the driving experience.
This is where many Recharged buyers focus: late‑model cars with verified battery health and a documented history.
How Recharged helps in the “value zone”
Ready to find your next EV?
Browse VehiclesSelling strategies around the 5‑year mark
From the seller’s side, the 5‑year mark is where the depreciation story changes. The free‑fall phase is largely behind you, but the car hasn’t yet aged into “classic EV” territory where values stabilize purely on price and running condition.
- Years 3–4: You’re still ahead of the bulk of buyers who wait for deeper discounts. If your car is low‑miles and clean, this can be a smart exit point.
- Years 5–6: You’re closer to the flat part of the curve; each additional year costs you less in depreciation, so holding longer often makes sense if the car is reliable and suits your needs.
- After year 7: The market prices the car primarily on condition, battery health, and repair risk. Depreciation slows, but a big repair can wipe out several years of gentle value loss.
Leaning into vs. exiting depreciation
How to estimate your own Tesla Model S 5‑year value
You don’t need a PhD in statistics to get a reasonable estimate of where your Model S sits on the 5‑year curve. A simple framework will get you into the right ballpark quickly.
5 steps to map your personal depreciation curve
1. Start with real current market value
Look up current retail and private‑party prices for your exact year, trim, and similar mileage. Tools from valuation sites plus actual asking prices on used‑EV platforms, and Recharged listings, are your baseline.
2. Compare that to your original MSRP
Find your original window sticker or build price. If that’s not handy, estimate MSRP using historical configurators or pricing guides for your model year.
3. Calculate your personal 5‑year percentage loss
Take (Original MSRP – Current Value) ÷ Original MSRP. If your five‑year‑old car is worth $34,000 on a $98,000 sticker, you’ve lost about 65% of MSRP.
4. Adjust for condition and history
If your car is unusually clean, low‑miles, or loaded with desirable options, add a few points back. If it has high miles, cosmetic damage, accident history, or battery concerns, be conservative.
5. Sanity‑check against similar listings
Search for comparable Model S cars by year and mileage. If your estimate is way above or below live listings, the market is telling you something. Price, or negotiate, accordingly.
Private‑party vs. trade‑in curves
Battery health, software, and their impact on depreciation
With EVs, the battery and software are the beating heart of resale value. Two outwardly similar Model S sedans can sit on very different depreciation curves depending on how their packs and tech have aged.
How battery and software move your depreciation curve
Same badge, very different value paths.
Strong battery health
A Model S whose pack still tests close to its original capacity, shows normal DC fast‑charging use, and has no history of thermal events tends to sit above the average curve. Buyers will pay a premium for confidence in long‑term range.
Compromised or unknown battery
Noticeable range loss, unclear charging history, or warnings in the battery system can drag a car well below the typical curve. The market prices in the risk of an expensive repair or replacement.
Up‑to‑date software and features
Regular over‑the‑air updates, popular options (Enhanced Autopilot, premium audio), and clean system behavior make a car feel modern longer and help it hold value.
Outdated software or missing features
Cars that have missed updates, lost features, or carry older hardware that can’t support newer functions may feel ‘left behind,’ even if they drive well. That perception accelerates depreciation.
Don’t gloss over battery reports
How Recharged helps you beat the Model S depreciation curve
Recharged exists for exactly this problem: taking a complex, fast‑moving EV market and making it simple enough that you don’t get blindsided by depreciation or battery risk.
- Recharged Score battery diagnostics: Every vehicle on the platform, including the Model S, comes with a Recharged Score Report that verifies real battery health, charging history indicators, and overall condition so you’re not buying blind.
- Fair‑market, data‑driven pricing: Recharged benchmarks each car against current market data so you can see if a particular Model S sits above, below, or right on the expected 5‑year curve.
- Used‑EV specialists on call: EV‑focused advisors can walk you through where a specific car lands on the depreciation curve and whether it’s priced appropriately for its age and pack health.
- Financing, trade‑in, and consignment: Whether you’re buying, trading, or selling a Model S, Recharged can coordinate financing, instant offers, or consignment, along with nationwide delivery and support from its Experience Center in Richmond, VA.
Use the curve to your advantage
Tesla Model S depreciation curve FAQ
Frequently asked questions about the Model S 5‑year curve
The bottom line on the Tesla Model S 5‑year depreciation curve
Over a five‑year horizon, the Tesla Model S depreciation curve is steep, but predictable. From the top of the curve, the first owner often watches 60% or more of the original MSRP melt away. From the middle of the curve, a savvy used‑EV buyer sees the same car as a bargain: flagship‑level performance and range for the price of a new midsize sedan.
If you’re shopping, focus on cars that have already cleared the steep early drop, prioritize verified battery health, and use real‑world pricing data rather than gut feel. If you’re selling, understand where your car sits versus that 5‑year curve and decide whether it’s time to exit or enjoy a few more years of slower depreciation.
Either way, tools like the Recharged Score Report, EV‑savvy pricing, and expert guidance can turn depreciation from a mystery into a manageable line item, and help you get the most from every mile in your Model S.