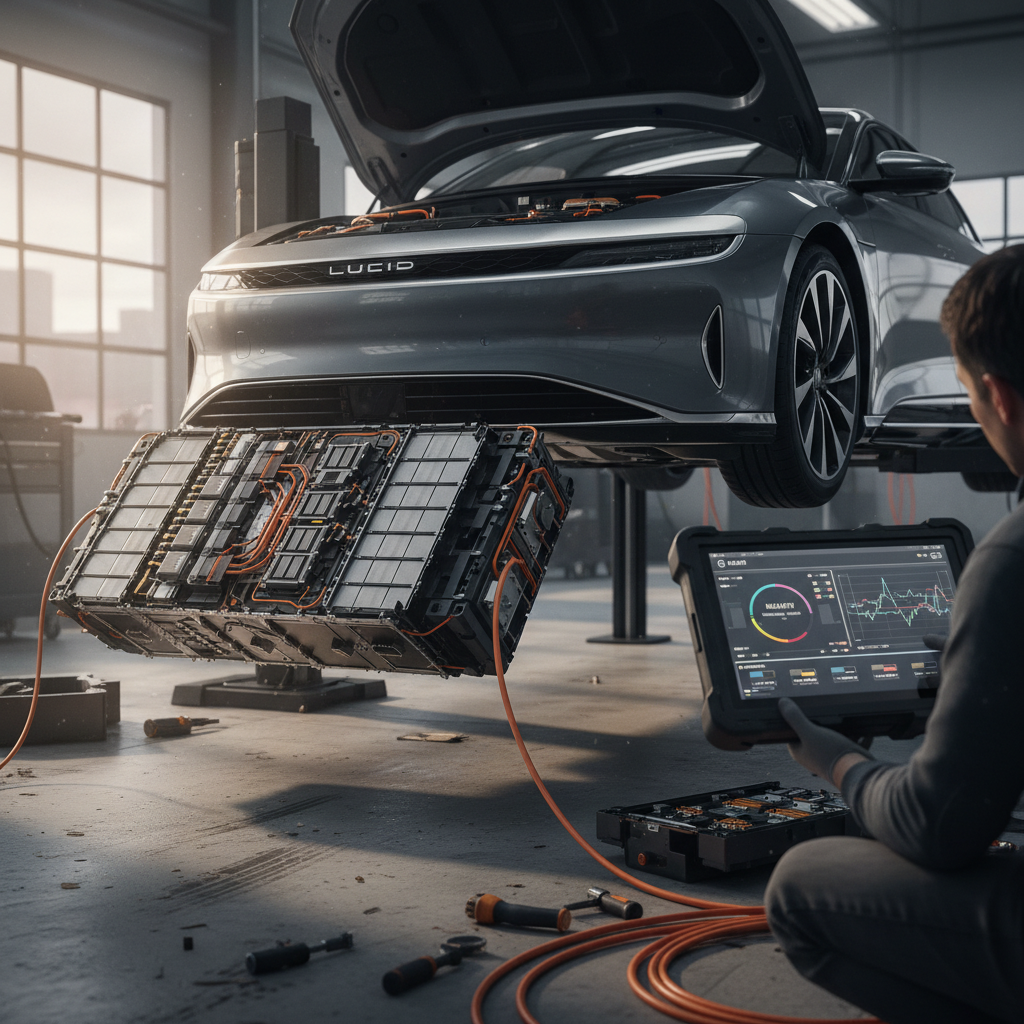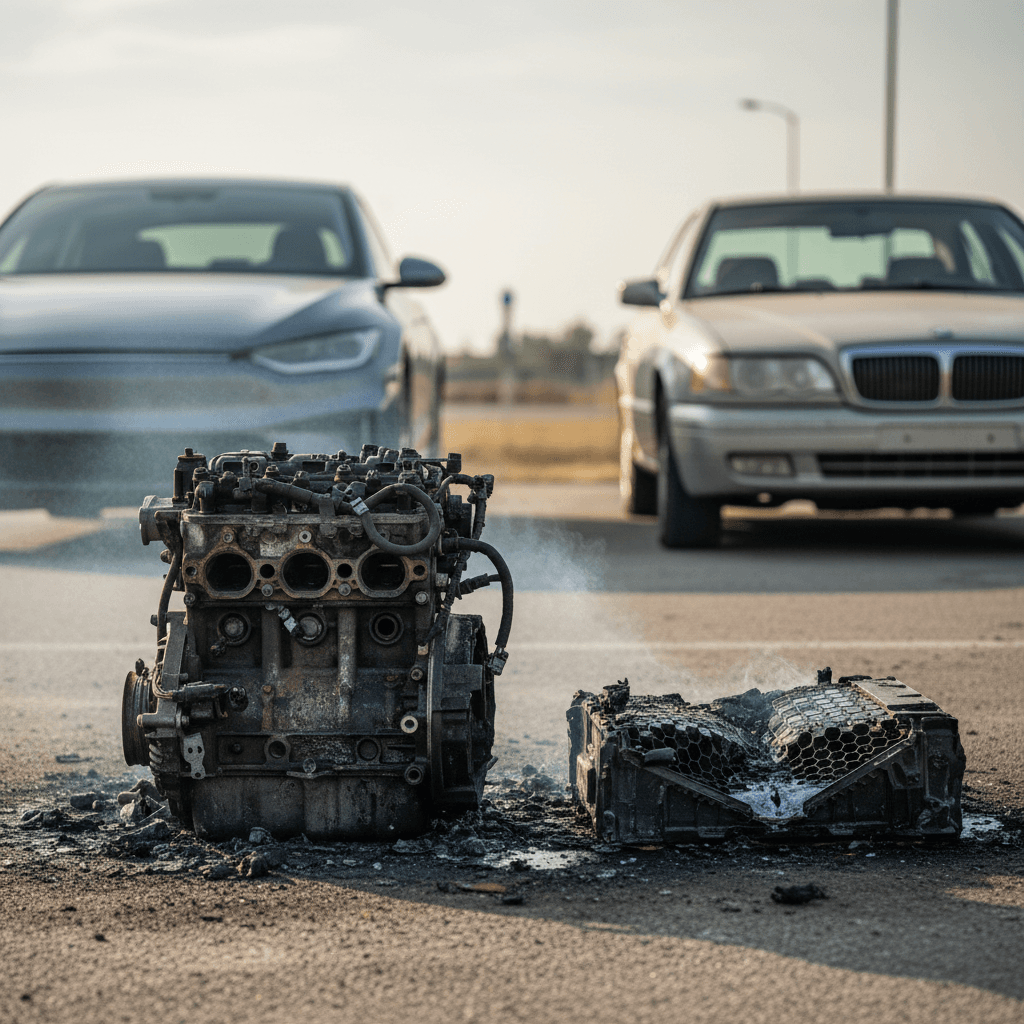
If you only judged by headlines, you’d assume electric vehicles are rolling Molotov cocktails. Search “EV fire” and you’ll drown in viral videos of Teslas on flatbeds and charred battery packs. But when you dig into EV fire risk statistics vs gas cars, a very different picture emerges: EVs catch fire far less often than gasoline vehicles, by an order of magnitude or more.
Key takeaway in one line
Why people think EVs catch fire more often
Let’s start with the perception problem. EV fires are rare, but they’re spectacular. They involve high-voltage battery packs, specialized firefighting foam, and sometimes multi-hour cooling operations. That makes great TV. By contrast, there are hundreds of gasoline car fires in the U.S. every single day, most of which never make local news, let alone national coverage.
- Novelty bias: EVs are still new enough that anything going wrong feels newsworthy.
- Video bias: Lithium-ion thermal runaway looks dramatic on camera, even though it’s statistically rare.
- Lack of context: News coverage almost never compares EV fires to the background noise of gasoline vehicle fires.
- Mixing EVs and hybrids: Many articles lump hybrids into “EV” stats, even though plug‑in and conventional hybrids have different risks.
Perception vs reality
Headline EV vs gas fire risk statistics
EV fire risk statistics vs gas and hybrid cars
This is the stat that should be taped to every charging station in America. On a per‑vehicle basis, EVs are dramatically less likely to catch fire than gasoline cars. Hybrids, which carry both a fuel system and a high‑voltage battery, actually sit at the wrong end of the spectrum.

Per-vehicle vs per-mile: how to read the numbers
There are two big ways to slice EV fire risk statistics vs gas cars: per vehicle and per mile driven. Both matter, and both tell the same basic story, EVs are safer, but you’ll see slightly different ratios depending on which lens you use.
Two ways to compare EV and gas fire risk
Per‑vehicle risk is easier to grasp; per‑mile risk matters to statisticians.
Per-vehicle fire rate
Think of this as: “Out of 100,000 vehicles on the road, how many will catch fire in a year?”
- EVs: around 25 fires per 100,000 vehicles.
- Gasoline cars: roughly 1,500 per 100,000.
- Hybrids: around 3,400+ per 100,000.
This is the easiest way to talk about risk as an ordinary driver.
Per-mile fire rate
This measures fires per miles driven, which accounts for usage differences.
- NFPA data suggests one vehicle fire for about 18–19 million miles of travel in the U.S. fleet.
- Tesla reports about one fire for every 130–200 million miles driven in its vehicles over the last decade.
Per‑mile, Teslas show fire rates roughly 5–10× lower than the U.S. vehicle average. ([tesla.com](https://www.tesla.com/en_in/VehicleFireSafetyReport?utm_source=openai))
Why the ratios differ
Hybrids: the surprising highest fire risk
If you’re just scanning headlines, you might assume the riskiest thing you can do is plug a battery‑electric car into a fast charger. Statistically, though, the real outliers are hybrid vehicles, both conventional hybrids and plug‑in hybrids.
Approximate fire rates by propulsion type (recent global data)
High-level comparison of fire incidents per 100,000 vehicles by propulsion type based on 2023–2025 compilations.
| Vehicle type | Fires per 100k vehicles | Approx. fire rate (%) | Relative risk vs EV |
|---|---|---|---|
| Battery-electric EV | ~25 | 0.025% | Baseline |
| Gasoline / diesel ICE | ~1,530 | ~1.53% | ≈61× higher |
| Hybrid (HEV / PHEV) | ~3,475 | ~3.48% | ≈139× higher |
These numbers aggregate multiple regions; exact rates vary by country and year, but the ranking is consistent: hybrids highest, then gas, with battery‑electric EVs lowest.
Why do hybrids fare so badly? Because they combine all the failure modes. They carry a flammable liquid fuel system, high‑voltage battery pack, dual cooling systems, and more complex wiring harnesses. Every additional subsystem is another way things can go wrong.
Don’t lump “EVs” together
What makes EV fires different (not more likely)
So: EV fires are rarer, but they’re also different. Lithium‑ion cells don’t behave like gasoline. When they fail catastrophically, usually after a severe crash or major abuse, you see what firefighters call thermal runaway: rapid heat buildup inside the cells, venting flammable gas, and self‑sustaining combustion until the energy is spent.
How EV fires behave
- Slower to ignite: Cells usually need significant abuse (crash damage, manufacturing defect, severe overheating) to enter thermal runaway.
- Longer to manage: Departments sometimes spend hours cooling a pack, and may use tens of thousands of gallons of water to prevent re‑ignition.
- Potential for re‑light: Damaged cells can smolder and flare up again hours or days later if not properly monitored.
How gas car fires behave
- Quick to ignite: Fuel leaks, hot exhaust components, or electrical shorts can lead to a flash fire.
- Easier to extinguish: Firefighters are deeply familiar with these events; water and foam tactics are straightforward.
- Lower re‑ignition risk: Once fuel is consumed or contained, the fire is mostly done.
The good news for occupants
Real-world case studies: Tesla and beyond
Tesla sits at the center of the public conversation about EV fires, so it’s worth looking at the data, not the memes. Tesla publishes its own safety report, and third‑party analysts have cross‑checked it against national fire statistics.
Tesla fire rates vs U.S. fleet averages
Normalizing fire incidents by miles driven shows where EVs actually stand.
Tesla’s reported rate
Between 2012 and 2023, Tesla reports roughly one vehicle fire per ~130–200 million miles traveled across its fleet.
U.S. fleet average
NFPA and U.S. DOT data point to about one vehicle fire per 17–19 million miles traveled for the overall U.S. vehicle fleet, dominated by ICE vehicles.
Relative risk
On a per‑mile basis, Tesla vehicles appear to be roughly 5–10× less likely to be involved in a fire than the U.S. vehicle average. ([tesla.com](https://www.tesla.com/en_in/VehicleFireSafetyReport?utm_source=openai))
EV fires are rarer, not gentler. When they do happen, they’re operationally complex for fire services, but statistically, they are a small fraction of total vehicle fires.
Away from Tesla, national fire agencies in Sweden, Norway, Australia and elsewhere report the same pattern: combustion vehicles generate several times more fires per vehicle than battery‑electric cars. Even as EV market share climbs, they contribute a single‑digit slice of total vehicle fires.
What this means if you’re shopping for a used EV
If you’re sifting through listings for a used EV and wondering, “Am I buying into a fire risk?”, the answer from the statistics is: no more than, and usually far less than, a gasoline car of the same age. But risk is never zero, and used EVs add one more variable, the life story of that battery pack.
Used EV fire risk: what actually matters
Three things to look at when you’re evaluating a pre-owned electric car.
Accident & repair history
High‑energy crashes that intrude into the battery pack are the main fire concern. Look for:
- Prior collision damage near the floorpan or rocker panels.
- Insurance total‑loss history.
- Improper or undocumented structural repairs.
Battery health & abuse
Chronic overheating, repeated DC fast‑charging under high load, or manufacturing defects can increase risk.
A good report will:
- Show state of health (SoH) and cell balance.
- Flag unusual temperature/voltage behavior.
Quality of service & recalls
For both EVs and gas cars, ignoring recalls is asking for trouble.
- Confirm all software and safety recalls are completed.
- Prefer vehicles serviced at OEM‑authorized or EV‑specialist shops.
How Recharged reduces the unknowns
Ready to find your next EV?
Browse VehiclesHow insurers and fire services see EV risk
If EVs catch fire less often, why do you sometimes hear about higher insurance premiums or “EV fire surcharges”? The answer is less about frequency and more about cost and complexity when things go wrong.
From the insurer’s desk
- Higher repair costs: Multiple 2023–2024 reports find EV collision repairs running roughly 20–30% higher than comparable ICE vehicles, thanks to expensive battery packs, sensors and calibration work.
- Similar total-loss rates: Recent data shows battery‑electric total‑loss frequency around 10%, in the same ballpark as newer ICE vehicles, but the dollar amounts involved can be higher.
- Impact on premiums: Insurers price for repair cost and loss severity, not just fire probability, so EV premiums can skew higher even when fires are rarer. ([fenderbender.com](https://www.fenderbender.com/news/latest-news/news/55242769/impact-point-affects-claims-severity-for-evs-vs-ice-vehicles?utm_source=openai))
From the fire chief’s view
- Training & equipment: Departments are updating playbooks for high‑voltage incidents and stocking isolation tools and larger water supplies.
- Longer on‑scene times: A stubborn battery pack can tie up crews and apparatus for hours, even though such calls are rare compared with gas fires.
- Policy evolution: Some agencies now recommend quarantining damaged EVs after major crashes to monitor for delayed thermal events.
Rarer events, evolving protocols
Checklist: stay safe in any car, EV or gas
The most practical question isn’t “Will my EV spontaneously combust?” but “What can I do to minimize risk in whatever I’m driving?” Here’s a simple checklist that applies to EVs, hybrids and gasoline cars alike.
Practical fire‑safety checklist for drivers
1. Keep up with recalls
Sign up for manufacturer and NHTSA recall alerts using your VIN. For EVs, software updates can directly affect thermal management and charging safety; for ICE cars, fuel‑system recalls are critical.
2. Respect charging and fueling rules
Only use approved charging equipment and outlets for EVs, and avoid daisy‑chained extension cords. For gas cars, never top off the tank after the nozzle clicks and don’t store fuel cans inside the cabin.
3. Watch (and smell) for warning signs
In any car, burning smells, smoke, or warning lights about the powertrain, battery, or charging system are reasons to pull over safely and investigate. In an EV, a sudden “car needs service” plus heat or odor deserves immediate attention.
4. After a serious crash, assume caution
If an EV or hybrid has heavy underbody or side impact damage, treat the battery as potentially compromised even if the car still drives. Have it towed to a shop with EV expertise and let insurers handle it from there.
5. Give firefighters clear information
If you are ever involved in a fire or severe crash, tell first responders what kind of vehicle they’re dealing with (EV, hybrid, gas) and where high‑voltage components are located if you know.
6. Choose well‑documented used cars
When shopping used, prioritize vehicles with complete service histories, clean title status, and third‑party battery health reporting, like the Recharged Score report included with every EV on our platform.
EV fire risk vs gas cars: FAQ
Frequently asked questions about EV vs gas fire risk
Bottom line: are EVs safer than gas cars?
Strip away the hype and you’re left with a simple, slightly unglamorous truth: modern battery‑electric vehicles are less likely to catch fire than gasoline cars, whether you measure by vehicles on the road or miles driven. Hybrids, for all their virtues, tend to carry the highest fire risk because they bundle both drivetrains into one shell.
None of that means EVs are magic or risk‑free. They just move the risk profile around: fewer routine fires, more complex handling when serious incidents occur. As an owner or shopper, your job is straightforward, buy a well‑documented vehicle, keep up with software and recalls, and pay attention if the car tells you it’s unhappy.
If you’re exploring a used EV, that’s exactly the gap companies like Recharged exist to close. With verified battery health, fair‑market pricing, and EV‑savvy support from first click to delivery, you can choose electric for all the usual reasons, quiet, quick, clean, without losing sleep over what happens deep inside the pack.