If you’ve ever watched your EV sprint from 10% to 50% and then crawl from 80% to 100%, you’ve seen the EV charging percentage vs time curve in action. Charging speed is not linear, and understanding that curve is one of the easiest ways to save time, protect your battery, and plan more relaxed road trips.
In one sentence
EV charging percentage vs time: the basics
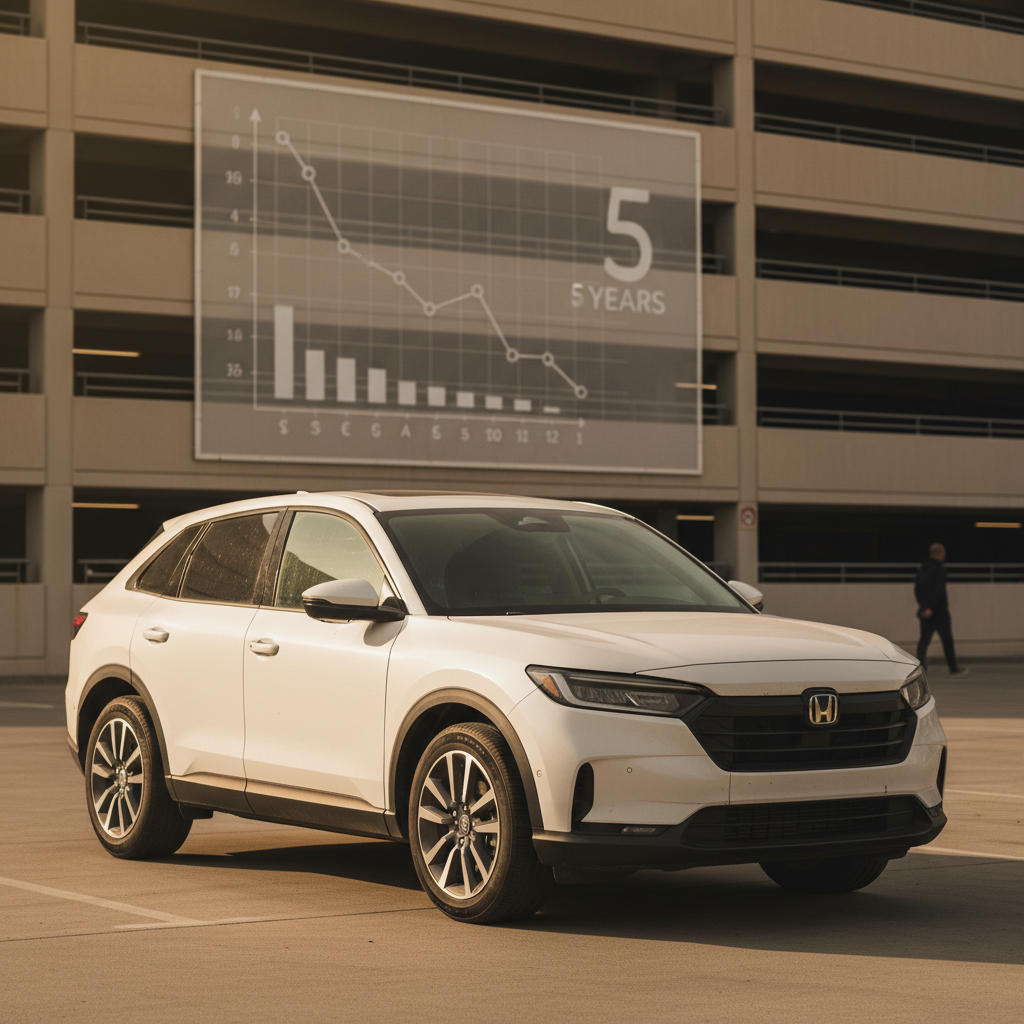
When people talk about EV charging percentage vs time, they’re really talking about the charging curve, a graph that shows how quickly your battery fills up over time. On the x‑axis you have time; on the y‑axis you have state of charge (SoC) from 0% to 100%. The key thing to know: the line is not a straight diagonal. It’s more of a curve that starts steep and then flattens as you get close to full.
- From 0–10%: Some cars start a bit cautiously, then ramp up quickly.
- From ~10–60%: This is usually the fastest part of the charge, especially on DC fast charging.
- From ~60–80%: The car starts to taper (slow down) to control heat and voltage.
- From ~80–100%: Charging gets significantly slower, great for range in a pinch, but not for your schedule.
Every model has its own curve, two cars rated for the same peak fast‑charge power can still charge at very different average speeds. That’s why your friend’s crossover might stay above 150 kW to 60%, while your sedan drops much earlier even on the same charger.
Why EV charging slows after 50–80%
The slowdown you see on the charger screen isn’t a bug, it’s the car protecting itself. Modern EVs all use lithium‑ion batteries, and they don’t like being shoved full of energy at max speed when they’re already nearly full. So the battery management system (BMS) steps in and reduces current as SoC rises.
What’s really happening inside the battery?
Three main reasons your charge rate falls off at higher percentages
Heat management
Voltage limits
Cell balancing
Why ‘just one more 10%’ feels so slow
AC vs DC charging curves
Not all charging curves look the same. AC charging (Level 1 and Level 2) and DC fast charging behave differently, even though the same battery is on the other end.
AC charging (Level 1 & Level 2)
- Power: Typically 1–2 kW (Level 1) or 6–11 kW (Level 2) at home in the US.
- Curve shape: Relatively smooth and consistent from low to high SoC.
- Use case: Overnight home charging, workplace charging, long parking stays.
- Experience: You rarely notice tapering; it just feels “slow but steady.”
DC fast charging (Level 3)
- Power: Roughly 50–350 kW at public stations today.
- Curve shape: Steep initial ramp, then pronounced taper after ~50–80% SoC.
- Use case: Road trips and quick top‑ups on the go.
- Experience: Early minutes fly by, later minutes feel painfully slow.
A simple rule of thumb
Real-world EV charging percentage vs time examples
Let’s put some shape to this. Exact numbers vary by model, charger, temperature, and battery size, but we can sketch out what a typical modern EV might do under good conditions.
Sample DC fast charging session (good conditions)
Illustrative example for a mid‑size EV on a 150 kW DC fast charger with a healthy battery.
| State of charge | Approx. time window | Typical power range | What it feels like |
|---|---|---|---|
| 10% → 50% | ~10–15 minutes | 120–150 kW | Charge % races upward; big jumps every minute. |
| 50% → 80% | ~15–20 minutes | 60–110 kW | Still moving, but jumps are smaller and slower. |
| 80% → 90% | ~10–15 minutes | 25–60 kW | Feels sluggish; you start checking your watch. |
| 90% → 100% | ~10–20 minutes | <25 kW | Creeping upward; you’re paying a lot of time for little range. |
Numbers are approximate, but the pattern, fast at low SoC, slow at high SoC, is what matters.
On Level 2 at home, the same car might take 7–9 hours to go from 10% to 100%, but the increase in SoC is far more uniform. There’s still a bit of taper up high; you just don’t feel it as acutely because you’re sleeping, not standing next to a charger.
How much time between 0–20–50–80–100%?
When you’re planning your day or a trip, you’re really asking: How long will it take to add the percentage I need? Here’s a way to think about it for a typical mid‑size EV (~60–80 kWh pack) in good conditions.
Approximate DC fast charging time by percentage band
0–20%: Emergency rescue
This can be fairly quick if the car allows high power at very low SoC, often in the 10–15 minute range to get you back to a comfortable buffer. Many drivers try not to spend a lot of time lounging below 10–15% unless necessary.
20–50%: The sweet spot for road trips
On a capable car and strong charger, you might pick up this 30% band in 10–15 minutes. You get a big chunk of usable range while the battery is still happy to accept high power.
50–80%: Still reasonable, but slowing
Expect this 30% band to take closer to 20 minutes or more. The taper is in full swing now, especially in colder weather or with repeated fast‑charge sessions.
80–100%: The patience test
Adding the last 20% can take 20–30 minutes on many cars, time that could often be better spent driving to the next stop and charging again from a lower SoC.
Don’t plan road trips around 0–100% stops
Best practices: ideal charging percentages for daily use
For everyday commuting, errands, and school runs, you almost never need 100%, and your battery will thank you if you stop short of it. Most manufacturers today suggest keeping your daily target somewhere around 70–85%, especially if you charge every night or several times a week.
Simple targets for daily charging
- Set your car’s charge limit to around 80% for daily use (many EVs let you do this in the settings).
- Use home Level 2 charging to creep up to your limit overnight instead of chasing fast chargers daily.
- Only charge to 100% when you know you’ll start driving soon after the car reaches full, don’t leave it sitting at 100% all day.
- If you regularly arrive home with 40–60% left, dial your daily limit down a bit; your battery doesn’t need to be “topped off” every single night.
Planning road trips around charging curves
On a road trip, time matters more than ending every stop at 95–100%. Because charging slows so much at higher percentages, it’s usually faster overall to make more frequent, shorter stops between, say, 10–70% than fewer, long stops from 10–100%.
Strategy A: Fewer, long 10–100% stops
- Very long sessions where the last 20–30% crawls.
- You spend a lot of time on the worst part of the charging curve.
- Looks efficient on paper, feels frustrating in real life.
Strategy B: More, short 10–60% or 15–70% stops
- Focuses on the fastest part of the curve.
- Stops are shorter and easier to align with meals and breaks.
- Often cuts total charging time even with one extra stop.
How to put this into practice
Battery health: how your charging strategy matters
Your EV’s charging curve is designed to protect the battery, but your habits still make a difference over years of ownership. Keeping your battery between roughly 20–80% most of the time, relying on Level 2 instead of constant DC fast charging, and avoiding extreme heat or cold when possible all help slow long‑term degradation.
Habits that support a healthy charging curve
Rely on Level 2 for the bulk of your charging
Home or workplace Level 2 lets the pack charge gently at moderate power, which is kinder to the cells than daily DC fast charging.
Limit fast charging when you don’t need it
Occasional road‑trip fast charging is fine; using DC fast charging as your primary fuel source, especially to high SoC, will age the battery faster.
Avoid long sits at 0% or 100%
If you run very low, charge soon. If you charge to 100% before a trip, time it so you hit full shortly before you leave.
Precondition in extreme weather
Many EVs can warm or cool the battery before a fast charge. That keeps the curve closer to its ideal shape and reduces stress.
What this means when buying used
How Recharged uses charging data when you buy used
When you’re shopping for a used EV, you can’t see the car’s charging curve on a spec sheet, but you can see how the battery has held up. That’s where the Recharged Score Report comes in. Every EV we list includes a verified view of battery health, along with pricing, history, and expert commentary.
Charging curves you don’t have to guess about
How Recharged helps you understand the battery behind the numbers
Verified battery diagnostics
Transparent history
EV‑specialist guidance
If you’re comparing two similar used EVs and wondering which one will feel better to live with, this is where an objective look at battery condition and realistic range matters more than a perfect 0–100% charge spec on paper.
EV charging percentage vs time: FAQ
Frequently asked questions about EV charging percentage vs time
Key takeaways: Charge smarter, not just fuller
When you understand how EV charging percentage vs time really works, the way you use your car can change overnight. You stop chasing 100% “just because,” start planning road trips around the fastest part of your charging curve, and lean on slow, steady Level 2 charging to keep your battery happy.
- Expect fast charging to be quickest between roughly 10–60%, then taper between 60–80%, and slow sharply above 80%.
- For day‑to‑day life, set a charge limit around 70–85% and use home or workplace Level 2 whenever you can.
- On road trips, favor more frequent, shorter stops in the quick middle of the curve over marathon sessions to 95–100%.
- If you’re buying used, look beyond brochure numbers and pay attention to actual battery health, real‑world range, and how the car was likely charged.
If you’re ready to put that knowledge to work and find a used EV that fits your driving and charging style, Recharged can help. Every vehicle we list comes with a Recharged Score Report, nationwide delivery options, and EV‑specialist support so you can shop with the same confidence you’ll feel watching that charging curve behave exactly the way you expect.