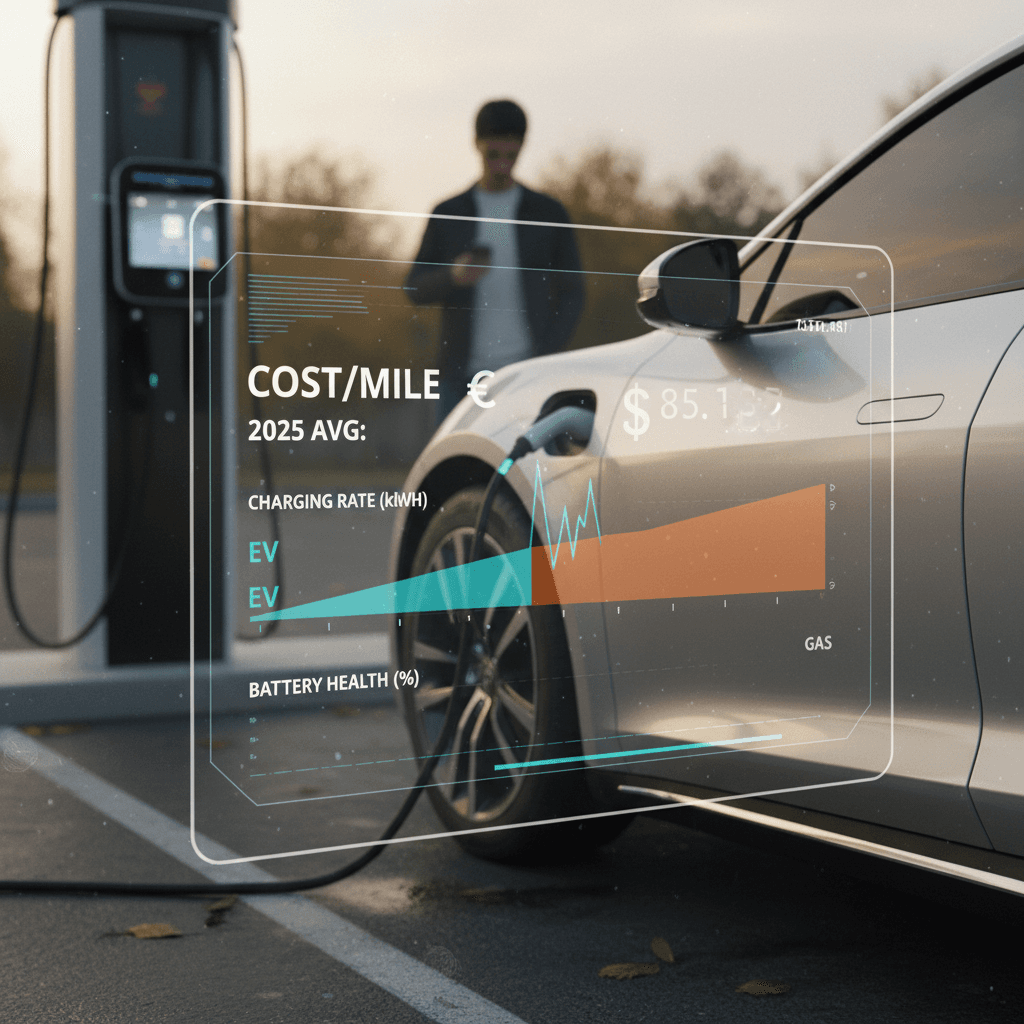
There’s no single EV-versus-gas result that applies to every driver. Your answer comes from comparing the dollars you actually pay with the miles each vehicle covers, especially if you rely on public charging rather than a home charger. For a wider look at electricity expenses, see how much it costs to charge an electric car.
How do you calculate EV and gas cost per mile?
Calculate both vehicles in dollars per mile using the same driving period. A kilowatt-hour, abbreviated kWh, is the unit of energy on an electricity bill or charging receipt; MPG tells you how many miles a gasoline car travels on one gallon. Multiply a dollars-per-mile result by 100 if you want to express it as cents per mile.
- Actual EV cost per mile = total charging dollars paid ÷ miles driven.
- Estimated EV cost per mile = electricity price per kWh ÷ wall efficiency in miles per purchased kWh.
- Gas cost per mile = gasoline price per gallon ÷ the vehicle’s actual MPG.
- Compare the two results using the same routes and time period.
The actual-cost method is the strongest because it captures the amount billed at the charger or utility meter. If you use the estimate, calculate wall efficiency by dividing miles driven by the kWh you purchased; that incorporates energy lost while charging. For public stations with session, parking, or time-based charges, include the entire session bill.
Use several charging or fueling cycles
Charging location can change the comparison
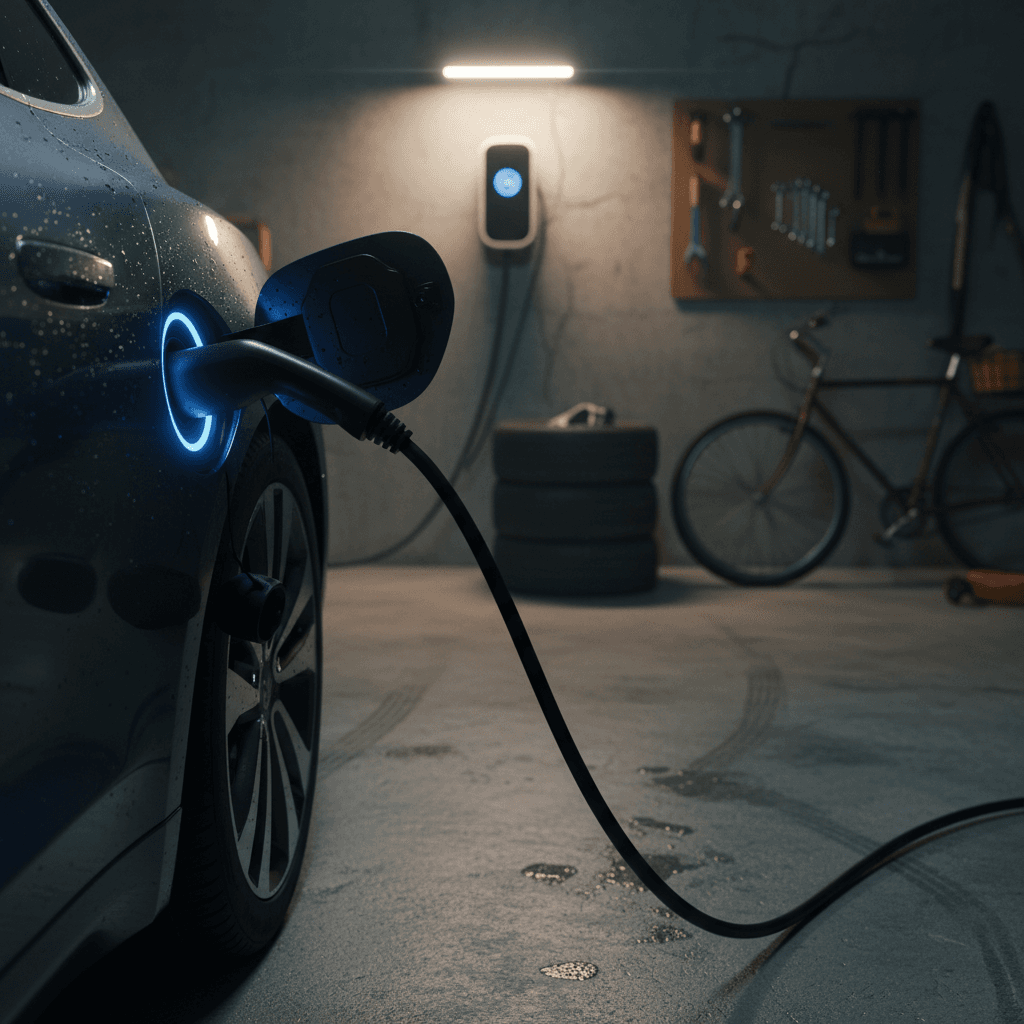
The price input changes depending on where and how you charge, so separate home and public sessions when possible. Level 2 is the common higher-power AC charging used at homes and public stations, while DC fast charging supplies direct current for quicker public charging. If you’re planning a residential setup, review the EV home charging guide before estimating your long-term cost.
Which charging cost should you use?
Use the amount you were actually billed whenever it is available.
| Charging option | Price input | Efficiency input | Watch for |
|---|---|---|---|
| Home AC charging | Utility energy charge | Purchased kWh per mile | Time-of-use rates |
| Public AC charging | Full session total | Actual session miles | Parking or session fees |
| DC fast charging | Full session total | Actual session miles | Time-based fees |
The same EV can have different costs per mile under different charging arrangements.
Collect these inputs before comparing
Your electricity cost
Use the applicable utility rate or the complete public-charging session total.
Your EV’s measured efficiency
Divide actual miles by purchased kWh so charging losses are included.
Your local gas price
Use the price you would realistically pay at the stations you visit.
The gas car’s actual MPG
Use your observed fuel economy rather than relying only on a published estimate.
Comparable driving
Measure both vehicles over similar routes, speeds, temperatures, and trip patterns.
What Recharged data adds to the cost picture
Recharged data shows why energy cost should be considered alongside battery condition and purchase price, not substituted for them. Across 2,242 Recharged Score inspections, tested remaining battery capacity averaged 93.9%, the median was 94.9%, and tested real-world range averaged 266 miles. These figures describe inspected battery condition and range; they do not, by themselves, determine charging cost per mile.
Across 1,796 EVs sold by Recharged over the trailing 12 months, buyers paid a median retail price of $27,297 and an average retail price of $29,901. Those are final retail sale prices, while your charging calculation measures ongoing energy expense. The takeaway is to evaluate a used EV on both its verified condition and its projected operating costs; learn more about EV battery health and the Recharged Score inspection.
For a fair comparison, use the amount on the charging bill and the miles you actually drove. That captures your vehicle, route, conditions, and charging setup better than a one-size-fits-all estimate.
Recharged data
Used EV battery health
94%
avg remaining capacity
From Recharged battery inspections, not manufacturer estimates.
- Lowest
- 63%
- Median
- 95%
- Highest
- 100%
- Est. range
- 266 mi avg
- Cell balance pass
- 100%
- Quick charges
- 18 avg
- Slow charges
- 65 avg
Average cell imbalance: 7.3 mV
Based on vehicles Recharged tested
Recharged data
Recent EV sold prices
$27,297
median sold price
What buyers actually paid through Recharged, not list price.
- Lowest
- $500
- Average
- $29,901
- Highest
- $129,998
Monthly median sold price
Based on Recharged sales in the last 12 months
Every EV is battery-tested with a Recharged Score. Nationwide delivery.
Find your break-even electricity rate
Your break-even rate is the highest electricity price at which the EV’s energy cost still matches the gasoline car’s fuel cost. Calculate it as: gas price per gallon × EV wall efficiency ÷ gas-car MPG. If your actual electricity price is below that result, the EV costs less for energy per mile; if it is above the result, the gas car costs less for fuel per mile.
Use miles per purchased kWh for EV wall efficiency so the calculation accounts for charging losses. When a public network adds flat, parking, idle, or time-based fees, the simpler approach is to divide the full session total by the miles driven from that energy. This break-even comparison covers energy only, not financing, depreciation, insurance, registration, maintenance, or charger installation.
Instant offer, trade-in, or consignment. Pickup available.
EV charging cost versus gas FAQ
The bottom line
An EV wins the energy-cost comparison when its actual charging cost per mile is lower than gas price per gallon divided by actual MPG. Use bills, receipts, and miles driven rather than assuming every EV or every charging location costs the same. If you’re considering a pre-owned model, pair this calculation with verified battery diagnostics and the broader checks in the used EV buying guide.